
Abstract
Publishing in academic journals is primary to disseminate research findings, with authorship reflecting a scientist’s contribution, yielding academic recognition, and carrying significant financial implications. Author numbers per article have consistently risen in recent decades, as demonstrated in various journals and fields. This study is a comprehensive analysis of authorship trends in biomedical papers from the NCBI PubMed database between 2000 and 2020, utilizing the Entrez Direct (EDirect) E-utilities to retrieve bibliometric data from a dataset of 17,015,001 articles. For all publication types, the mean author number per publication significantly increased over the last two decades from 3.99 to 6.25 (+ 57%, p < 0.0001) following a linear trend (r2 = 0.99) with an average relative increase of 2.28% per year. This increase was highest for clinical trials (+ 5.67 authors per publication, + 97%), the smallest for case reports (+ 1.01 authors, + 24%). The proportion of single/solo authorships dropped by a factor of about 3 from 17.03% in 2000 to 5.69% in 2020. The percentage of eleven or more authors per publication increased ~ sevenfold, ~ 11-fold and ~ 12-fold for reviews, editorials, and systematic reviews, respectively. Confirming prior findings, this study highlights the escalating authorship in biomedical publications. Given potential unethical practices, preserving authorship as a trustable indicator of scientific performance is critical. Understanding and curbing questionable authorship practices and inflation are imperative, as discussed through relevant literature to tackle this issue.
Introduction
Authorship in biomedical sciences: relevance, conventions, guidelines, proliferation
Authorship in scholarly journal publications indicates a scientist’s genuine contribution to the work. It demonstrates the intellectual efforts and accomplishments and conveys scientific prestige and esteem, which translates into opportunities for research funding, patent applications, and personal financial benefits (Bennett & Taylor, 2003; Claxton, 2005; Cronin, 2001; Greene, 2007; Shapiro et al., 1994; Sharma & Verma, 2018; Strange, 2008). Beginning with the PhD degree, the usual criteria for academic careers are publication output and/or citation counts, cumulative impact factors, and a ranking of author positions (Greene, 2007; Shapiro et al., 1994; Sharma & Verma, 2018). This is based on an assumed direct correlation between the number of authorships and the individual’s productivity (academic performance), where authorship is considered a return on investment due to the quantitative metrics mentioned above and the academic incentive systems that use such metrics (Cronin, 1996; Greene, 2007; Sharma & Verma, 2018).
Until the early twentieth century, single authorship was the norm, but became more and more uncommon (“demise of the lone author” (Greene, 2007)) since approximately 1920 when multicenter studies and collaborative research grew (Baethge, 2008; Bennett & Taylor, 2003; Claxton, 2005; Cronin, 2001; Greene, 2007; Thelwall & Maflahi, 2022; Wuchty et al., 2007). The shift from single-authored to co-authored papers raised two fundamental questions: a) who qualifies as an author, and b) what significance has the ordering of authors (position in the author byline)? Regarding the latter, in some disciplines (mathematics, physics, economics), a strict determination is occasionally circumvented by simple alphabetical listing of the authors. In biomedical publishing, the first (greatest contribution to the study) and last author position (senior author, supervision, overall responsibility) are those with the highest “value” while the authors in between (contributing) are listed according to their relative contribution to the study—although these conventions are neither definitive nor founded on explicit definitions of author positions (Baerlocher et al., 2007; Bennett & Taylor, 2003; Claxton, 2005; Fernandes & Cortez, 2020; ICMJE, 2022; Rahman et al., 2021; Shapiro et al., 1994; Sharma & Verma, 2018; Strange, 2008). Regarding the first question on who qualifies for authorship, the currently most widespread guideline covering authors’ roles and requirements has been developed by the International Committee of Medical Journal Editors (ICMJE),Footnote 1 stating that (all) four distinct criteria (in brief: contribution to/revising of/approving/responsibility for a manuscript) must be met to qualify for authorship (ICMJE, 2022). Again, this recommendation is not without controversy or suggestions for modification (Lee, 2009; Lin, 2023; Miles et al., 2022; Strange, 2008).
These questions have gained importance as the progressive increase in volume and output of scientific research due to scientific and technological advancements (Grieger, 2005; Weinberg, 1961) was accompanied by an increase in the number of authors per publication (Greene, 2007; Grieger, 2005; Grobbee & Allpress, 2016; Lee, 2009). The trend in “authorship proliferation” is most noticeable in high-energy physics and biomedicine (Changa et al., 2019; Cronin, 2001; Pell, 2019) and also well documented in biomedical publishing for single or sets of journals, publications types, disciplines or clinical specialties (see discussion for references).
For example, in a science-wide journal-based study on 88 million journal articles between 1900 and 2020 listed in Scopus,Footnote 2 the strongest increases in author numbers for life science and health-related broad fields was found for immunology & microbiology and biochemistry, genetics & molecular biology, followed by neuroscience, medicine and pharmacology, toxicology & pharmaceutics; here, the geometric mean of co-authors per article rose from between 1 and 1.5 before 1930 to 5–6 in 2020 (Thelwall & Maflahi, 2022). A similar rise in average co-author numbers per publication had been shown in a previous large-scale study on articles in the ISI (Institute for Scientific Information) Web of Science in the field of science & engineering from below two authors per article in 1960 to approximately 3.5 in 2000 (Wuchty et al., 2007).
Authorship proliferation has led to the adoption of novel terms such as multi- or multiple authorship (Cronin, 2001; Rahman et al., 2021), which refers to the co-authoring of papers by 2–99 authors. Some studies have further categorized multi-authored papers (MAPs) based on specific numbers (e.g., megaauthorship in case of more than five authors; see (Changa et al., 2019) and citations therein). However, even the term multiauthorship seems understated in face of the ever-growing number of papers with many more than 100 authors listed. For example, 1014 authors are listed in a 2015-paper on fruit-fly genomics (Leung et al., 2015). Not less than 2080 authors are listed on a paper from high energy physics (Khachatryan et al., 2010), which “needed 165 lines on the PubMed site to spell out their surnames and initials” (Marusic et al., 2011). A 2017-paper in astrophysics had 3674 authors (Abbott et al., 2017) and in 2021, during the pandemic, the number of co-authors peaked at over 15,000 in a multi-center study on the efficacy of SARS-CoV-2 vaccination on post-surgical COVID-19 infections and mortality (Covidsurg Collaborative, 2021). The issue of substantial authorship inflation (or proliferation) in some disciplines was addressed by Cronin, who coined the term hyperauthorship to name this increasing manifestation of multiauthorship and asked, if this tendency might indicate a structural shift in scientific communication or if it might be seen as mere perversion (Cronin, 2001). Such extreme examples might be explained by increased research complexity, increasingly sophisticated methodology, multidisciplinary research, larger research units, internationalization, multicenter collaborations and stronger involvement of graduating students in biomedical science (An et al., 2020; Baethge, 2008; Cronin, 2001; Greene, 2007; Grobbee & Allpress, 2016; Lutnick et al., 2021; Ojerholm & Swisher-McClure, 2015; Singh Chawla, 2019; Thelwall & Maflahi, 2022). Given the importance of authorship for individual academic careers, the growing pressure to publish, driven by promotion policies and reward structures, alongside unethical practices like gift authorship, are considered additional factors leading to authorship inflation (An et al., 2020; Greene, 2007; Grieger, 2005; Grobbee & Allpress, 2016; Kornhaber et al., 2015; Lee, 2009; Levsky et al., 2007; Rahman et al., 2021; Tilak et al., 2015).
Research questions
Against this background and focusing on biomedical publications, the current study’s objective was a large-scale bibliometric, retrospective, quantitative per-year analysis of authorship of publications listed in the PubMedFootnote 3 database.
Specifically, all articles of 13 common publication types (Table 1) of each year between 2000 and 2020 were included in the analysis, journal articles in the first place as the most frequent and primary publication type for the dissemination of original research. By avoiding an arbitrary selection of articles (e.g., in (sets of) journals, disciplines etc.), we aimed for an unbiased, generally applicable assessment of authorship trends in the biomedical literature over all research fields. The study is based on the following research questions: (a) to what extent has the number of authors per publication increased between 2000 and 2020 for all or for single publication types? (b) is such a tendency accompanied by (significant) decreases in single-authored papers overall and for single publication types? and (c) which of the analyzed PubMed publication types were most affected by changes in the proportions of multi- and single-authored articles in this period?
Methods
Data retrieval
Bibliometric data were retrieved from the U.S. National Institute of Health (NIH) National Library of Medicine (NLM) National Center of Biotechnology Information (NCBI) PubMed database comprising > 33 million citations including all MEDLINE content as PubMed’s primary component.Footnote 4 The Entrez Direct (EDirect) E-utilities “esearch”, “efetch”, and “xtract” were used to access the database system (currently 38 databases of biomedical data including the PubMed Kans, 2022; Sayers, 2017)). E-utilities were run in the macOS Unix terminal application.
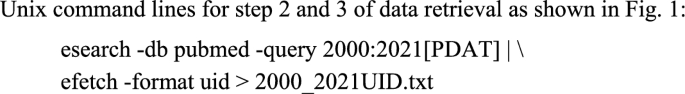
Figure 1 depicts the data retrieval and extraction strategy. A local copy of PubMed baseline was built on an external Solid-State Drive (SSD) by executing the “archive-pubmed” command included in EDirectFootnote 5 (step 1 in Fig. 1). As of the latest update of the local copy on February 28, 2022, the archive contained ~ 33.5 million entries. An “esearch” query for the year published (publication date, search field abbreviations [PDAT]) was performed from 2000 to 2020 (first line of the Unix command lines shown below, corresponding to step 2 in Fig. 1). The data query was performed on March 10, 2022 (accession date). This query was connected to the online retrieval of the unique identifiers (UIDs) of all PubMed entries from 2000 to 2021 as a text file (2000_2021UID.txt) using “efetch” (second line of the command lines below, step 3 in Fig. 1). In case of the PubMed, this returns the entries’ PMIDs. (Although not included in the final analysis, the entries of 2021 were included in the UID retrieval). Unix command lines for step 4 and 5 of data retrieval as shown in Fig. 1.
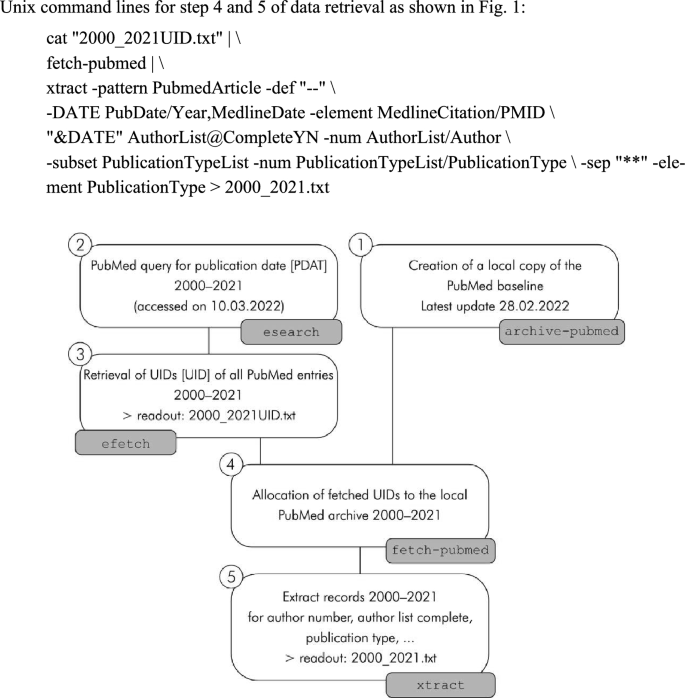
Flow chart illustrating the data retrieval and extraction workflow. Data were retrieved from a locally archived PubMed baseline database using Entrez Direct (EDirect) E-utilities on the Unix command line (Kans, 2022; Sayers, 2017) based on UID (PMID) numbers. Search field abbreviations in square brackets. E-utilities and commands are shown in grey rounded rectangles. For details see text
The entries in the 2000_2021UID.txt file were allocated to the respective entries in the locally stored PubMed archive by executing “fetch-pubmed” (first and second line of the command lines below, step 4 in Fig. 1). Finally, the data element pattern relevant for further analysis was specified and extracted from the local archive and stored as a text file (2000_2021.txt) using “xtract” (lines three to seven of the command lines below, step 5 in Fig. 1). This returned a complete list of all distinct PubMed entries from 2000 to 2021 with the following elements extracted:
-
Author number per record
-
Author list complete: check for complete author lists (all authors are listed)
-
Publication type(s)
Inclusion and exclusion criteria
The 13 included publication types consisted of commonly found types like journal articles, reviews, and case reports, in addition to various clinical trials, meta-analyses, and systematic reviews (Table 1). The publication types of Clinical Trial, Clinical Trial–Phase I (first in man), Clinical Trial–Phase II (proof of concept), Clinical Trial–Phase III (pivotal studies), and Clinical Trial–Phase IV (post marketing) were jointly analyzed and are denoted as Clinical Trial, I–IV.
Comparatively rare publication types (e.g., Webcast, Twin Study, Letter, Lecture, or Portrait) were excluded as well as work published in abstract form only. Also, publications without authors listed were excluded, which affected 0.84% of articles across all years and publication types with a minimum of 0.52% in 2013, and a maximum of 1.71% in 2000. Publications assigned to multiple publication types were included in the analyses of all publication types specified. This affected 64.48% of articles across all years and publication types with a minimum of 42.11% in 2017, and a maximum of 71.92% in 2004.
The NCBI policy on the listing of authors in the byline have changed over time. From 1966 to 1983 all authors were included. From October 29, 1983, authors per publication were limited to a maximum of ten. With 1966 (date of publication) there was a limit of 25 (1–24 plus last author, the rest was omitted). Effective with 2000, the personal author limit was removed and as of mid-2005 all limitations were lifted so that from that point all authors, also of hyperauthored papers may be listed (NIH–NLM, 2020). Therefore, all articles included in the present study should have all authors listed in the byline without truncations applied. To verify complete author listing, the “author list complete” element was included in the data extraction pattern.
Data management and processing
Data in the 2000_2021.txt file were processed with Microsoft Power Query, filtered based on publication year, author numbers, and types, then analyzed in Microsoft Office 365 Excel (version 16.60) using Pivot tables. The results were exported to Microsoft Excel (.xlsx) for additional analysis and graphing in GraphPad Prism 10.
Data analysis and statistics
Descriptive statistics included sample size (N), average author numbers as arithmetic and geometric mean ± 95% confidence interval (CI) and the standard deviation (SD). Median author numbers were also calculated and are shown in Online resource 2. Statistical testing was performed using two-tailed t-tests for unmatched (unpaired) samples, or ordinary one-way analysis of variance (ANOVA) with Tukey’s multiple comparisons test. Means were considered as statistically significant at p-values < 0.05.
Literature survey
A systematic literature search was performed (general Web search and specifically in the PubMed) between September 2021 and April 2022 and continuously updated until submission of this manuscript. The following search terms, truncations thereof and keyword combinations were used with Boolean operators: author, authorship, biomedical, growth, guideline, hyperauthorship, increase, inflation, multiauthorship, multiple, progression, proliferation, recommendation, trend.
Results
The figures demonstrating the trends in authorship are presented in absolute numbers, displaying both the arithmetic and geometric means of authors per publication. Median values are given in Online Resource 2. Throughout the results text, tables, and discussions, we have opted to use only arithmetic means, facilitating a more direct comparison with the findings of other studies, the majority of which also rely on arithmetic means (i.e., average numbers).
Author numbers per publication increased overall
In total 17,015,001 PubMed articles published between 2000 and 2020 were included. Across all 13 publication types, the number of articles per year steadily increased almost threefold from ~ 490,000 in 2000 to over ~ 1.3 million in 2020 (Fig. 2A and Table 2). In the same period, the mean number of authors per publication significantly increased from 3.99 to 6.25 (+ 57%, p < 0.0001). Regressions (best fits determined by empirical evaluation) for mean author numbers are shown in Online Resource 1 for the overall analysis and for sub-analyses of the selected publication types listed in Table 1. Overall, the increase in author numbers followed a linear trend (r2 = 0.99) with an average relative change of + 2.28% per year (Table 2).

Overall analysis of included publication types. A Arithmetic mean (authors mean) and geometric mean (authors geomean) of authors per publication and number of PubMed publications from 2000 to 2020. Mean ± 95% CI bands. B Percentages of single authors, 2–4 authors, 5–7 authors, 8–10 and 11 or more (11 +) authors per publication. C Publications with 100 or more authors per year from 2000–2020. D Overlay of histograms showing author number distributions in 2000, 2010 and 2020 (X-Axis truncated at 100 authors, Y-Axis in logarithmic scale)
While mean author numbers increased, the proportion of single-authored papers steadily declined by a factor of ~ 3 from 17.03% in 2000 to 5.69% in 2020 (Fig. 2B and Table 3). The proportion of papers authored by two to four authors decreased by approximately one third from 47.59% to 34.55%, while the proportions of articles with five to seven and eight to ten authors showed a 1.25-fold and 2.24-fold increase, respectively. Papers with eleven or more authors accounted for only 2.32% of articles in 2000 but reached 10% in 2018 and accounted for 11.24% of articles in 2020, i.e., a total increase by a factor of 4.84 between 2000 and 2020 (Table 3).
A remarkable trend emerged in publications with 100 or more authors, indicating an approximate doubling from the early 2000s to 2020. Prior to 2004, fewer than 100 articles annually had 100 + authors, surpassing 200 articles per year in 2015 (Fig. 2C). The shift to higher author numbers per publication over time is also obvious from the author number distributions overlay for the years 2000, 2010 and 2020 in Fig. 2D.
Author numbers increased for all selected publication types
Analyzing the publication types listed in Table 1 separately, potential variations in authorship trends were investigated. The outcomes of these sub-analyses are depicted in Figs. 3, 4, 5 and 6. Tables 2 and 3 present an overview of authorship changes from 2000 to 2020 for all publication types (cumulative) and for individual types based on the criteria outlined in section “Inclusion and exclusion criteria”.

Journal Articles and Review. (A, C) Arithmetic mean (authors mean) and geometric mean (authors geomean) of authors per publication and number of PubMed publications from 2000 to 2020. Mean ± 95% CI bands. (B, D) Percentages of single authors, 2–4 authors, 5–7 authors, 8–10 and 11 or more (11 +) authors per publication

Case Reports and Editorial. (A, C) Arithmetic mean (authors mean) and geometric mean (authors geomean) of authors per publication and number of PubMed publications from 2000 to 2020. Mean ± 95% CI bands. (B, D) Percentages of single authors, 2–4 authors, 5–7 authors, 8–10 and 11 or more (11 +) authors per publication

Clinical Trial, I–IV, Randomized Controlled Trial and Multicenter Study. (A, C, E) Arithmetic mean (authors mean) and geometric mean (authors geomean) of authors per publication and number of PubMed publications from 2000 to 2020. Mean ± 95% CI bands. (B, D, F) Percentages of single authors, 2–4 authors, 5–7 authors, 8–10 and 11 or more (11 +) authors per publication

Meta-Analysis and Systematic Review. (A, C) Arithmetic mean (authors mean) and geometric mean (authors geomean) of authors per publication and number of PubMed publications from 2000 to 2020. Mean ± 95% CI bands. (B, D) Percentages of single authors, 2–4 authors, 5–7 authors, 8–10 and 11 or more (11 +) authors per publication
Journal articles
Journal articles, the dominant publication type in PubMed, significantly influence the trends depicted in Fig. 1. The average author count per paper exhibited a significant linear rise (r2 = 0.99) from 4.07 in 2000 to 6.42 in 2020 (+ 58%, p < 0.0001), with an average annual relative change of + 2.31% (Fig. 3A, Table 2). The proportions of single and multiple authorships mirror the general findings, with single authors decreasing from 15.85% in 2000 to 4.78% in 2020 (a 3.3-fold decrease; Fig. 3B, Table 3). The proportions of papers authored by two to four, five to seven, eight to ten, and 11 + authors displayed changes consistent with the overall analysis (“Author Numbers per Publication Increased Overall” section).
Reviews
The count of review articles, the third-most frequent publication type in PubMed, more than doubled from ~ 65,000 in 2000 to ~ 136,000 in 2020 (Table 2). The mean author number per article increased by + 3.12% per year on average from 2.48 to 4.57 (+ 84%, p < 0.0001; Fig. 3C and Table 2) following a second order polynomial function (R2 = 0.99). Notably, review articles saw a strong ~ 4.3-fold decline of single authors from a relatively high level of 35.85% in 2000 to 8.28% in 2020 (Table 3) and a reciprocal increase of papers with five to seven authors (8.84% in 2000 and 25.12% in 2020), while the proportion of articles with two to four authors remained relatively stable over the years (Fig. 3D).
Case reports
Among all the examined publication types, case reports exhibited the slightest increase in mean author numbers per publication, rising by1.01 from 4.14 in 2000 to 5.15 in 2020 (+ 24%, p < 0.0001; Fig. 4A), with an average annual relative increase of 1.10% (linear, r2 = 0.99; Table 2). Similar to clinical trials, meta-analyses, and systematic reviews (Figs. 5 and 6), case reports had a relatively low proportion of single-authored articles from the beginning. In 2000, single-authored case reports accounted for 9.50%, decreasing to 2.39% in 2020 (Fig. 4B and Table 3). While the proportion of case reports with two to four and five to seven authors remained relatively stable throughout, the rise in mean authors primarily resulted from a 1.67-fold and 3.63-fold increase in articles authored by eight to ten and eleven or more authors, respectively (Table 3).
Editorials
In 2000, the average number of authors per editorial was 1.40 and increased 1.76-fold to 2.47 in 2020 (p < 0.0001; Fig. 4C) following a polynomial function (R2 = 0.96; Online Resource 1). The modest absolute rise in average author counts was accompanied by a drastic change in single authorship with a steady decrease from a high level of 72.39% in 2000 to 41.03% in 2020 (Fig. 4D). This 1.8-fold decline was coupled with a twofold rise in articles with two to four authors from 26.52% in 2000 to 50.67% in 2020 (Table 3). Editorials with five or more authors were rare before 2004 accounting for less than 1% altogether, but gradually increased thereafter. In 2020, 5.46% of articles had five to seven authors, which equals an almost sevenfold increase from 2000. Although not well discernible from the graph, editorials with eight to ten or 11 + authors increased 8.41-fold and 10.85-fold from 2000 to 2020 with a notable step from 2019 to 2020 (Fig. 4D).
Clinical trials
In total, data retrieval returned 291,699 publications between 2000 and 2020 consisting of Clinical Trial–Phase I to IV. From 2000 to 2004 the number increased from 22,320 to 26,524 and by 2006 abruptly halved to ~ 10,000 entries per year (Fig. 5A). From then, the number stayed relatively constant (9323 in 2020). The observed decrease in the count of clinical trials, not readily apparent through a standard web browser-based PubMed advanced search engine query, remains unexplained based on the present dataset. This discrepancy might stem from alterations in the PubMed indexing policy for clinical trials around 2005, potentially leading to the exclusion of certain subsequently published trials from the retrieval method employed in our study.
While the data retrieval for this publication type may be incomplete after 2006, there is a noticeable steady upward trend in mean author counts. Starting at 5.87 in 2000, mean author numbers increased to 11.54 authors in 2020 (p < 0.0001), which was the highest absolute change among all analyzed publication types (+ 97%; Fig. 5A and Table 2) following a polynomial function (R2 = 0.99) with an average relative change of + 3.45% per year (Online Resource 1 and Table 2).
The proportion of single authored publications steadily decreased from 3.85% in 2000 to around 1% in 2013 and further down to 0.43% in 2020, signifying a ~ ninefold reduction (Fig. 5B and Table 3). A notable decline was observed in the proportion of articles with two to four authors from 36.02% to 10.16% (~ 3.6-fold reduction) and in those with five to seven authors from 37.93% to 24.24% (~ 1.6-fold reduction). Conversely, there was a substantial increase in articles with eleven or more authors by ~ sixfold from 7.32% in 2000 to 43.47% in 2020 (Fig. 5B and Table 3).
Randomized controlled trials
With 5.72 in 2000, the average number of authors of randomized controlled trials (RCTs) was similar as in clinical trials, but the increase to 8.74 until 2020 (+ 53%, p < 0.0001) was flatter (Fig. 5C and Table 2) following the same second order polynomial trend (R2 = 0.99). The single authorship trend was congruent with that of clinical trials showing a steady ~ sixfold decline from 3.78% in 2000 to 0.63% in 2020 (Fig. 5D and Table 3). RCTs with two to four authors decreased ~ 1.9-fold, while those with eight to ten and 11 + authors increased 1.48-fold and 3.25-fold, respectively. The proportion of RCTs with five to seven authors remained relatively constant over time (~ 38%).
Multicenter studies
The number of multicenter studies increased from ~ 5000 to ~ 20,000 and had the highest average number of authors per paper of all analyzed publication types with 7.37 in 2000 and 12.92 in 2020 (+ 75%, p < 0.0001; Fig. 5E and Table 2) with an average increase of 2.86% per year (Table 2). following a polynomial function (R2 = 0.99; Online Resource 1). Single authorships dropped ninefold from 4.30% in 2000 to less than 0.47% in 2020 (Fig. 5F and Table 3), closely resembling trends observed in clinical trials and RCTs. Particularly evident is the high proportion of studies with eleven or more authors already in 2000, accounting for 19.85%. The proportion surged to 50.04% in 2020, marking a steepening around 2010. Multicenter studies with two to four and five to seven authors decreased ~ threefold and ~ 1.5-fold, respectively, while multicenter studies with eight to ten authors consistently accounted for ~ 22% (Fig. 5F).
Meta-analyses
Along with an almost 20-fold increase in meta-analyses from 838 in 2000 to 16,417 in 2020, author counts increased by 63% from 4.16 to 6.77 (p < 0.0001; Fig. 6A and Table 2) following a sigmoidal function (R2 = 0.99; Online Resource 1) with an average relative increase of 2.56% per year (Table 2). Single authorships peaked in 2001 (13.57%) and thereafter massively dropped ~ 12.5-fold to 0.85% in 2020 (Fig. 6B and Table 3). Until 2008, meta-analyses with two to four authors accounted for more than 50% (59.6% in 2003). Subsequently, there was a transition towards more than five authors per publication.
Systematic reviews
Similar as meta-analyses, the count of systematic reviews strongly increased by ~ 17-fold from 1401 in 2000 to 24,414 in 2020. The mean author number per article linearly (r2 = 0.99) increased by + 3.31% per year on average from 3.18 to 6.05 (+ 91%, p < 0.0001) (Fig. 6C and Table 2). The trends in single-, co- and multiauthorships are comparable with those found for meta-analyses. A particularly noticeable aspect is the strong ~ 11-fold decline in single authorships from 11.71% in 2000 to 1.02% in 2020 (Fig. 6D and Table 3).
Discussion
Discussion of results, literature review
The results of this study including over 17 million PubMed entries support the hypothesis that between 2000 and 2020 there had been a significant increase in the mean number of authors of biomedical publications and a decrease of single-authored papers over time, in general and for analyzed publication types (summarized in Tables 2 and 3). Overall, the arithmetic mean (average) author number per publication increased from 3.99 to 6.25 (+ 57%). The steepest increase was observed for clinical trials (+ 97%), the mildest increase for case reports (+ 24%). Overall, the increase followed a linear trend with + 2.28% per year, while individual publication types such as reviews, editorials and different types of trials and clinical studies showed a curved, polynomial upward trend (Online Resource 1). The proportion of single authorships decreased ~ threefold overall. With a 12.5-fold and ~ 1.75-fold reduction, meta-analyses and editorials showed the strongest and mildest decline in solo authorships, respectively. For reviews, editorials, and systematic reviews, a dramatic, up to 12.3-fold increase in the percentage of eleven or more authors was found, while solo authorship dropped to 1% and below for clinical trials, randomized controlled trials, multicenter studies, and meta-analyses. The drop in solo authorship in editorials—although relatively small compared to other publication types and the shift towards two to four authors per article is especially remarkable, given that this article type has traditionally been single-authored.
In general, and across the different publication types, the arithmetic and geometric mean author counts per publication follow the same trend, although the geometric means are lower and time courses are less steep, owing to their resilience against outliers. This difference is particularly noticeable for editorials in 2020 and meta-analyses in 2012, and generally becomes more pronounced over time, reflecting the increasing skewness of the data due to the increasing prevalence of multi- and hyper-authored articles over the years.
The present study covered all major (common) publication types in PubMed, the largest publicly accessible database of biomedical literature with currently more than 33 million citations, without restrictions, e.g., limitation to specific journals and/or research fields/topics or clinical specialties. We chose the PubMed article-based classification versus a journal-based approach as e.g., underlying Scopus broad and narrow fields (Elsevier, 2023; Thelwall & Maflahi, 2022). Consequently, it is presumed that the study provides comprehensive and unbiased data on the overall trend of authorship growth in biomedical literature over the last two decades, both generally and for individual publication types. During the past decades, authorship trends have been surveyed in several studies, mostly using more confined study concepts as compared to the comprehensive approach used here. With consistency, however, all these studies have evidenced increasing author numbers per paper over time and decreasing proportions of solo authorships. To put the present study in context with published data, Table 4 summarizes the central outcomes, inclusion criteria and the periods of analysis of relevant previous studies (without claim for completeness). Besides the primary outcome, i.e., change (increase) in number of authors as presented in Table 4, the following findings are worth mentioning. Along with generally increasing numbers of authors, (i) less authors have been observed in long-established journals compared to newer journals (Lutnick et al., 2021), (ii) advanced academic degrees and a shift in the proportion of articles from North America and United Kingdom to continental Europe and the Far East (Camp & Escott, 2013) with highest numbers of authors for paper from Japan, China, Italy, and, Germany (Chow et al., 2015) could be observed, (iii) most of the studies addressing the authors’ sex at the first (and last) author position found (significantly) increasing proportions of female authors (Chien et al., 2020; Gu et al., 2017; Hsu et al., 2021; Seetharam et al., 2018; Sheridan et al., 2018), (iv) multidisciplinary and multi-institutional affiliations increased, and, (v) higher average author numbers were found on more influential papers, i.e., those with higher relative citations rates (An et al., 2018).
Taken together, despite variations in study designs, inclusion criteria, and study durations, the findings on authorship trends biomedical literature compiled in Table 4 demonstrate a strong uniformity in the steady rise of average author numbers per publication throughout the years. Notably, the two extensive studies mentioned earlier, conducted by Thelwall and Maflahi (Thelwall & Maflahi, 2022) and Wuchty et al. (Wuchty et al., 2007), examining 88 million papers from 1900 to 2020 and 20 million research articles published between 1950 and 2000, respectively, showed nearly identical findings. Despite their use of a distinct science-wide methodology relying on the Scopus and ISI Web of Science databases, in contrast to our study confined to biomedical literature using PubMed, the results were remarkably similar.
In the present study from 2000 to 2020, the highest increases (absolute mean authors > + 5.5) were observed for clinical trials and multicenter studies (Table 2). Among the different clinical specialties, the highest increases were found in orthopedics with + 3.5 (Camp & Escott, 2013; Lutnick et al., 2021), radiation oncology with + 4.8 (Ojerholm & Swisher-McClure, 2015) and cardiothoracic surgery with + 6.1 authors (Modi et al., 2008). However, since these studies spanned longer periods, it is unsurprising to observe more pronounced absolute increases (Table 4).
The upward trend in average author counts per publication coincides with a gradual reduction in the prevalence of single authorships, observed across all publication types, research disciplines, and clinical specialties. Regarding different publication types, within the last 20 years, the strongest declines in solo authorships were evident for clinical trials, randomized controlled trials, multicenter studies, meta-analysis, and systematic reviews (Table 3). Among different clinical disciplines and subspecialities, the most striking drops observed in previously published studies were cardiothoracic surgery (> –90%) (Modi et al., 2008), plastic surgery (up to − 75%) (Durani et al., 2007) and in biomechanics (Knudson, 2012), where solo authorships completely vanished within 20 years (Table 4). These results imply, that the “demise of the lone author” (Greene, 2007), is not a recent phenomenon, but has been in progress at least since the 1930s. On the other end of the scale, from the early 2000s until 2020, hyperauthored articles with 100 or more authors (Cronin, 2001) have doubled from less than 100 articles per year before 2004 to over 200 as of 2015 (Fig. 2C). The apparent leveling off between 2016 and 2019 and subsequent decline in 2020 were not continued, as evidenced by a surge to over 300 PubMed articles with 100 + authors in 2021 (data not shown). In addition to the overall rise in authorship, this consistent upward trend in hyperauthorship warrants careful examination in the future.
Limitations of the study
This study has several limitations. Regarding research fields, the generalized study approach does not allow for analyzing discipline-specific differences, i.e., those that may exist between biological specialties or (clinical) medicine, nursing to name a few. When choosing PubMed as the database source, changes of authorship were the focus of investigation rather concerning the type of publication. In addition to that, other factors possibly affecting author counts could also not be considered such as authorship demographics (geographical differences in authorship trends as e.g., surveyed in Camp & Escott, 2013; Chien et al., 2020; Gu et al., 2017)), academic degree (as e.g., shown in (Camp & Escott, 2013)), or funding sources (as e.g., in (Dotson et al., 2011)). Specifically, in future, there should be more focus on sex/gender-specific aspects and changes in authorship trends as e.g., in the study by Gu et al. (2017) in hand surgery, by Chien et al. in ophthalmology (Chien et al., 2020), by Hsu et al. in Radiology (Hsu et al., 2021), or by Seetharam et al. and Sheridan et al. in orthopedics (Seetharam et al., 2018; Sheridan et al., 2018). Similar to other affiliation-, geographic-, or funding-related details, retrieving authors' sex/gender in large-scale studies involving millions of entries is challenging. An accurate determination would necessitate focused, smaller-scale methodologies involving the scrutiny of individual publications and verification of gender through targeted internet searches, possibly utilizing science-specific online platforms like ResearchGate.Footnote 6
Another shortcoming of the present study is the ambiguity that arises from the assignment of individual articles to more than one publication type, which is an inherent property of the PubMed database most likely resulting from the attempt to uniformly reclassify all articles originally classified by the host journal using its own (divergent) nomenclature. On average, this affects 64.48% of articles across all years and publication types with a decreasing tendency over the two decades. E.g., a review or case report may also be classified as a journal article, or a systematic review or meta-analysis may also be categorized as a review, leading to the possibility of a single article being included in the analysis for multiple publication types.
Regarding the assumption that questionable authorship practices contribute to or are partly responsible for the escalation of author lists beyond justifiable extents (refer to the discussion below), this descriptive study, by its nature, cannot offer evidence on the specific quantitative impact of these practices, nor can it identify individual articles with inappropriate authorship.
Eventually, articles without author information (on average, 0.84% of articles across all years) and “rare” publication types were excluded (focus on the n = 13 most frequent and well-known types). Given their low frequency, both sets of articles should not influence the overall results.
Authorship proliferation and related ethical issues
Despite long-standing ethical guidelines on authorship (ICMJE, 2022), this and other referenced studies illustrate the persistent expansion of authorship in biomedical publications. This trend raises concerns regarding data integrity and quality control, as well as the individual author's contribution and accountability for the published work (Claxton, 2005; Cronin, 2001; Grobbee & Allpress, 2016; Kornhaber et al., 2015; Rahman et al., 2021). Reason for that are legitimate concerns that (some) researchers define authorship quite loosely and that authorship inflation leads to unjustified citations and consequently to a dilution of the intrinsic value of authorship (Baethge, 2008; Drenth, 1996).
The increases in author numbers have been explained by the requirement of multidisciplinary and multicenter collaborations in face of increasing research complexity and methodological advances which goes along with a growth in team sizes and a progressive transition to “team science” (Cronin, 2001; Greene, 2007; Grobbee & Allpress, 2016; Larivière et al., 2015; Lin & Lu, 2023; Ojerholm & Swisher-McClure, 2015; Singh Chawla, 2019; Thelwall & Maflahi, 2022; Tilak et al., 2015; Wuchty et al., 2007). Considering more laborious techniques, higher sample sizes and larger patient cohorts, multicenter approaches etc., this argument seems more than plausible from an epistemic point of view and undoubtedly justify the listing of a greater number of co-authors than in previous years. In addition, larger teams can produce more frequently cited work and more influential high-impact research than individual researchers or smaller groups (Larivière et al., 2015; Wuchty et al., 2007). However, a direct association between work-intensive research technologies and increasing author numbers has also be questioned, suggesting that behavioral and cultural practices like conferral of co-authorship could also play a role or even be more relevant (Epstein, 1993; Lin & Lu, 2023). Of note, correcting for self-citations decreased the relative impact of research teams especially in biomedical science (Wuchty et al., 2007), which suggests other than legitimate mechanisms acting in the background to drive co-authorship inflation.
Certainly, the mounting pressure faced by researchers to publish, driven by prevalent criteria for academic advancement and funding reliant on publication records and citation-based metrics, seems to be a key contributor to authorship inflation and the adoption of ethically dubious authorship practices (An et al., 2020; Baethge, 2008; Cronin, 2001; Greene, 2007; Grieger, 2005; Grobbee & Allpress, 2016; Kornhaber et al., 2015; Lee, 2009; Levsky et al., 2007; Rahman et al., 2021; Tilak et al., 2015). Indeed, multiple surveys have highlighted academic advancement and the pressure to publish, among other concerns associated with the interpretation of authorship (e.g., inadequate understanding and adherence to authorship criteria, or ambiguous definitions of authorship) as factors contributing to unwarranted authorship and (unethical) authorship-related practices (Rahman et al., 2021; Slone, 1996).
Common types of authorship-related irregularities are listed in Table 5. Notably, a form of unethical authorship behavior notoriously contributing to authorship inflation involves the bestowal of gift, honorary, or guest authorships. These individuals are typically not engaged in the work's conception, data acquisition, manuscript writing, or final approval, thus failing to meet any of the ICMJE criteria (ICMJE, 2022). Consequently, they cannot be held accountable for the published work (Bennett & Taylor, 2003; Claxton, 2005; Lee, 2009; Strange, 2008). The pressure to publish (or perish) has been shown to be the main motivation for these forms of undeserved authorship. It drives scientists (often junior scientists) to listing, for example, renowned senior colleagues as co- or senior authors for putative advantages in the peer-review process to increase the chance of the work to be published (Baethge, 2008; Bennett & Taylor, 2003; Grieger, 2005; Grobbee & Allpress, 2016). Similarly, mutual support authorship is an attempt to inflate publication lists by placing each other’s names on papers without a substantial contribution to the work that would justify a co-authorship, again mainly motivated by the pressure to publish (Claxton, 2005).
Several surveys have assessed self-reported prevalence of authorship irregularities in biomedical publications. Undeserved or honorary authorship has been reported in the range between eleven and 60%, with differences depending on the definition of honorary authorship, the chosen cohort of articles or journals and the period investigated (Flanagin et al., 1998; Kennedy et al., 2014; Shah et al., 2018; Slone, 1996; Varghese & Jacob, 2022; Wislar et al., 2011). A meta-analysis of 14 survey studies showed an average of 29% of researchers reporting their own or others’ experience with misuse of authorship (Marusic et al., 2011). Compared to other types of scientific misconduct (plagiarism, falsification, manipulation etc.), authorship misconduct and especially gift authorship was the most frequently reported form of research fraud (Dhingra & Mishra, 2014; Reisig et al., 2020). Notably, the proliferation in authorship, facilitated by gift authorship, primarily impacted senior authors' occupancy of first and last author positions (Drenth, 1998). The pressure to publish affecting senior colleagues might even lead to coercive authorship, where individuals misuse their authority or supervisory roles to secure authorship without making appropriate contributions to the published work (Bennett & Taylor, 2003; Claxton, 2005; Strange, 2008).
While authorship irregularities are generally perceived as problematic, these practices are evaluated differently from an ethical perspective. Many scientists classify these practices as questionable, low-grade misbehavior or as happening in a grey zone. Others unmistakably rate them as abusive, damaging authorship practices and outright scientific misconduct (Anderson et al., 2007; Dhingra & Mishra, 2014; Grieger, 2005; Shah et al., 2018; Sharma & Verma, 2018; Strange, 2008), along with fabrication, falsification, and plagiarism—grievous practices that clearly deviate from accepted rules within the scientific community (Martyn, 2003). In an attempt to correct authorship misuse, the editors of BMJ asked all corresponding authors to sign that the ICMJE criteria were met by all authors and that no eligible contributors were excluded from the list, but this measure did not lead to any changes in authorship behavior (Smith, 1997). It is possible that some researchers, despite acknowledging the four ICMJE criteria individually, object to the mandate that all four must be fulfilled by every author, perceiving this condition as overly stringent (Bennett & Taylor, 2003; Smith, 1997). Therefore, some suggest reimagining authorship guidelines to promote equity and fairness in co-produced research more flexibly (Lin, 2023; Miles et al., 2022) and call for even clearer rules on crediting co-authorship, especially when it comes to gift authorship (Singh Chawla, 2020).
Accurate authorship assignment is essential for maintaining the integrity of biomedical science. Undeserved and unjustified authorship not only misguides various stakeholders including journal editors, publishers, funding organizations, and those responsible for personnel decisions, but also creates an unfair advantage for certain scientists over those who adhere to authorship guidelines and potentially disadvantages fields where smaller teams remain prevalent (An et al., 2020; Baethge, 2008). Furthermore, the increase in authorship alongside fraudulent authorship practices undermines standard academic and scientific reward structures, which exclusively depend on publication and citation counts, as it provokes scientists to “game of the system” by inflationary assignment of authorship (Greene, 2007). This exacerbates the issue in a cycle of positive reinforcement. Ultimately, as expressed by Grieger, it is science that loses out (Grieger, 2005).
Alternatives—measures against authorship proliferation
Apparently, explicit authorship guidelines from institutions like the ICMJE (ICMJE, 2022) do not significantly influence the authors’ (mis)conduct. So, what could possibly change the present situation? Several remedies against authorship proliferation resulting from questionable authorship practices have been proposed and partially put into practice.
-
Alphabetical order: Some journals recommend arranging authors alphabetically, as commonly seen in fields like economics, mathematics, and business (Fernandes & Cortez, 2020). However, this method eliminates the ability to discern individual contributions, and the first and last authors’ positions are merely coincidental with respect to their initials (Fernandes & Cortez, 2020; Pell, 2019). This practice has proven unappealing in biomedical science, where author position traditionally denotes contribution, leading to authors with late-alphabet surnames avoiding these journals (Bennett & Taylor, 2003).
-
To align the number of authors per paper with their genuine contributions, it is advised to differentiate between authors and contributors more distinctly. Tasks that do not inherently meet authorship criteria, such as general supervision, advisory roles, funding acquisition, administrative support, writing assistance/proofreading, or material provision, should be acknowledged rather than included as authorship credits (Baethge, 2008; ICMJE, 2022; Lee, 2009; Strange, 2008).
-
Authorship agreements: The selection of authors should be a collaborative decision among co-authors, ideally made before project initiation and any practical work (Baerlocher et al., 2007; Bennett & Taylor, 2003; Claxton, 2005; Dotson et al., 2011; ICMJE, 2022; Sharma & Verma, 2018; Strange, 2008), possibly curbing authorship inflation during a project. To emphasize the significance and accountability of authorship, Strange recommended a written authorship agreement at the project's outset (Strange, 2008). However, this approach might be counterproductive, possibly favoring those who promise in advance over those who eventually deliver (Bhopal et al., 1997).
-
Corporate names (group authors): Large multi-author collectives are advised to adopt corporate names, functioning as an author entity in the byline (Grobbee & Allpress, 2016; ICMJE, 2022), and individual authors meeting the criteria are noted in footnotes on the first manuscript page or in acknowledgements, per journal preference, not in the byline (Liesegang et al., 2010). In PubMed (and the MEDLINE as integral part it), the individual group members appear as collaborators (investigators), but not in the author list.Footnote 7 Although this strategy seems viable and fair, its effectiveness is limited as publications are not recognized in systems like Web of Science which greatly reduces the appeal of this approach (Grobbee & Allpress, 2016). Corporate authorship remains uncommon, representing at most 3% of annual publications in select journals between 1980 and 2000 (Weeks et al., 2004). However, this approach may gain traction over time; for instance, in neuroscience, with 4.1%, group authorship surpassed single-authored papers in 1919/1920, indicating a potential trend (Lin & Lu, 2023).
-
Credit systems: Such systems aim to clearly define author contributions. For instance, Rahman et al. proposed a categorization system known as the “Author Performance Index (API)’ which utilizes designations such as first, co, principal, or corresponding author (Rahman et al., 2021). This tool is designed to offer a more objective approach to assessing contributor credit. Despite its objective aim, this model heavily relies on previous contributions, which does not necessarily reflect an individual’s input to a current project.
-
Author contribution statements: Journals following the ICMJE guidelines (ICMJE, 2022) increasingly request author contribution statements that list individual roles in a project, covering tasks from study conceptualization to manuscript writing, data analysis and supervision, and include information on supervision and funding acquisition. Such statements guide editors and readers in assessing the role of each contributor (Grieger, 2005; Smith, 1997). In practice, however, these statements still leave a margin of interpretation and creativity, and the impact of journal policy changes remains unverified by authorship trend studies. For example, Dong et al. found that leading gastroenterology journals saw a continued increase in the number of authors per publication, even after implementing author contribution requirements (Dong et al., 2016).
Obviously, there are no simple solutions for the problem—generally speaking, “there are almost never technical solutions to social problems” [in analogy to problems of the peer review system (Ferguson et al., 2014)]. Despite widespread implementation, the ICMJE criteria do not seem to have affected the authors’ conduct and all the aforementioned attempts to counteract authorship inflation have their limitations and shortcomings and have so far been of little avail.
An outlook on authorship
Guidelines and proposed measures against authorship proliferation are aimed at the researchers’ ethical commitment—they are aimed at the heart of the researcher, but probably not at the heart of the problem. Authorship, while providing recognition and personal fulfillment, serves as the primary metric for evaluating researchers, influencing their promotion, tenure, salary, and funding (Grobbee & Allpress, 2016; Lutnick et al., 2021; Pell, 2019). Evaluation systems primarily relying on citation metrics unintentionally fuel unethical conduct and “gaming of the system” (Greene, 2007) by inflationary assignment of authorship, which is extremely difficult to identify or sanction. Combined with a lack of disincentive for e.g., honorary authorship, such behavior is inevitably a result of current evaluation systems. To escape this vicious circle, in which author proliferation erodes the unique value of authorship and perverts the system, a rethinking of outdated academic assessment systems, reward frameworks, and funding agency policies is urgently needed (Grieger, 2005; Lutnick et al., 2021). Authorship proliferation highlights the need to develop alternative metrics other than purely counting publications to evaluate scientific productivity (Lutnick et al., 2021). For a paradigm shift to occur, evaluation policies that prioritize the quality of publications over sheer quantity, hereby reinforcing the ethical dedication of scientists, are required (Grieger, 2005). To restore the value of academic authorship, decisions-makers on career and funding should evaluate applicants based on the quality and specific contribution to the body of work, not solely the quantity of their publication record, as emphasized by Shapiro et al. (Shapiro et al., 1994). One strategy could involve applicants highlighting their most impactful publications within a designated timeframe (Drenth, 1996), as already implemented by certain funding bodies. The approach additionally entails introducing new academic performance metrics. A credit system could be implemented for collaborators whose contributions do not meet the rigorous criteria for authorship, holding them accountable for career advancement and funding acquisition. Acknowledging the roles of technical/methodological contributors, writers, and supervisors based on their specific inputs would not only address issues of excessive authorship and overcrowded bylines but also foster mutual respect and teamwork.
Practical relevance and educational implications
Although most research institutions have established guidelines on research ethics, there is a critical need to integrate authorship-related ethical considerations into education curricula, particularly in bioethics courses (Strange, 2008). Academic institutions should incorporate courses focused on research integrity in both graduate and postgraduate programs, addressing authorship issues along with other forms of scientific misconduct such as fabrication, falsification, and plagiarism (Anderson et al., 2007; Martyn, 2003; Shah et al., 2018). Early exposure to the ICMJE recommendations can raise the students’ awareness and ability to recognize unethical practices (Shah et al., 2018), underscoring the necessity of including authorship guidelines and ethical discussions within existing and future Bachelor’s, Master’s, and Ph.D. curricula. To develop a generation of ethical scientists, current leaders must lead by example and realize their actions have a “trickle-down effect” on those they train, as An et al. stated (An et al., 2020). Hence, also senior colleagues would profit from dedicated mentoring, training, and formal discussion on authorship, since it is primarily the senior leaders who must exhibit the courage and willingness to change the system (Lee, 2009). Moreover, institutions should self-reflect on institutional hierarchies and not coerce junior scientists into including non-authorship seniors e.g., as honorary authors. Ombudspersons must be in charge to support junior staff members in such situations (Shah et al., 2018). Given the possibility of rendering a paper unpublishable, institutions must establish clear protocols for resolving authorship disputes (Strange, 2008).
Taken together, integrating authorship policies into scientific culture through good scientific practice (GSP) guidelines and educational initiatives may curb authorship misconduct and limit further proliferation linked to questionable practices. However, awareness and training alone might still be insufficient (Shah et al., 2018) if external incentive and award systems continue to rely on current values (authorship, publications, “impact”). “Even with the establishment of well-defined authorship guidelines and mechanisms for resolving and preventing problems though, authorship abuse will still occur” as realistically noted by Strange (Strange, 2008).
Conclusions
Examining over 17 million PubMed articles in a recent period of 20 years, the study affirmed authorship proliferation in the biomedical literature. Notably, all analyzed publication types showed highly significant increases, especially multicenter studies, and clinical trials, with a concurrent decline in single-authored papers.
Credible explanations for this seemingly unstoppable trend are increasing research complexity, increasingly sophisticated methodology, multidisciplinary research, larger research units, internationalization, and multicenter collaborations. Although the current study design did not allow to test for the contribution of such explanations to the observed trend, the reported high frequency of authorship misconduct (honorary authorship etc.) suggest additional and different factors driving authorship inflation: mainly the (increasing) pressure to publish primarily induced by current academic performance assessments, promotion policies and reward structures which themselves mainly focus on quantitative citation metrics and publication counting. Against this background, this paper discusses possible approaches to limit authorship proliferation, to maintain its value, and how to sustainably embed a more sensitive attitude towards the ethical aspects of authorship. Achieving successful and enduring changes requires a joint effort of all stakeholders involved in scholarly communication, knowledge dissemination, and funding, including scientists, authors, contributors, journal editors, publishers, funding bodies, personnel decision makers and, finally, those we as authors primarily publish for—the readers.
Notes
http://www.icmje.org. As of February 2023, more than 7,900 journals state to follow the ICMJE recommendations in their authorship policies (http://www.icmje.org/journals-following-the-icmje-recommendations/).
References
Abbott, B. P., Abbott, R., Abbott, T. D., Acernese, F., Ackley, K., Adams, C., Adams, T., Addesso, P., Adhikari, R. X., Adya, V. B., Affeldt, C., Afrough, M., Agarwal, B., Agathos, M., Agatsuma, K., Aggarwal, N., Aguiar, O. D., Aiello, L., Ain, A., & Woudt, P. A. (2017). Multi-messenger observations of a binary neutron star merger. The Astrophysical Journal. https://doi.org/10.3847/2041-8213/aa91c9
An, J. Y., Baiocco, J. A., & Rais-Bahrami, S. (2018). Trends in the authorship of peer reviewed publications in the urology literature. Urology Practice, 5(3), 233–239. https://doi.org/10.1016/j.urpr.2017.03.008
An, J. Y., Marchalik, R. J., Sherrer, R. L., Baiocco, J. A., & Rais-Bahrami, S. (2020). Authorship growth in contemporary medical literature. SAGE Open Med, 8, 2050312120915399. https://doi.org/10.1177/2050312120915399
Anderson, M. S., Horn, A. S., Risbey, K. R., Ronning, E. A., De Vries, R., & Martinson, B. C. (2007). What do mentoring and training in the responsible conduct of research have to do with scientists’ misbehavior? Findings from a National Survey of NIH-funded scientists. Academic Medicine, 82(9), 853–860. https://doi.org/10.1097/ACM.0b013e31812f764c
Baerlocher, M. O., Newton, M., Gautam, T., Tomlinson, G., & Detsky, A. S. (2007). The meaning of author order in medical research. Journal of Investigative Medicine, 55(4), 174–180. https://doi.org/10.2310/6650.2007.06044
Baethge, C. (2008). Publish together or perish: the increasing number of authors per article in academic journals is the consequence of a changing scientific culture. some researchers define authorship quite loosely. Deutsches Ärzteblatt International, 105(20), 380–383. https://doi.org/10.3238/arztebl.2008.0380
Bennett, D. M., & Taylor, D. M. (2003). Unethical practices in authorship of scientific papers. Emergency Medicine (Fremantle), 15(3), 263–270. https://doi.org/10.1046/j.1442-2026.2003.00432.x
Bhopal, R. S., Rankin, J. M., McColl, E., Stacy, R., Pearson, P. H., Kaner, E. F., Thomas, L. H., Vernon, B. G., & Rodgers, H. (1997). Team approach to assigning authorship order is recommended. BMJ, 314(7086), 1046–1047.
Camp, M., & Escott, B. G. (2013). Authorship proliferation in the orthopaedic literature. Journal of Bone and Joint Surgery American, 95(7), e44. https://doi.org/10.2106/JBJS.L.00519
Changa, Y.-W., Huang, M.-H., & Chiu, M.-J. (2019). Hyperauthorship: a comparative study of genetics and high-energy physics research. Malaysian Journal of Library & Information Science, 24(1), 23–44. https://doi.org/10.22452/mjlis.vol24no1.2
Chien, J. L., Wu, B. P., Nayer, Z., Grits, D., Rodriguez, G., Gu, A., Ghassibi, M. P., Chien, G. F., Oliveira, C., Stamper, R. L., Van Tassel, S. H., Muylaert, S., & Belyea, D. A. (2020). Trends in authorship of original scientific articles in journal of glaucoma: An analysis of 25 years since the initiation of the journal. Journal of Glaucoma, 29(7), 561–566. https://doi.org/10.1097/IJG.0000000000001503
Chow, D. S., Ha, R., & Filippi, C. G. (2015). Increased rates of authorship in radiology publications: A bibliometric analysis of 142,576 articles published worldwide by radiologists between 1991 and 2012. American Journal of Roentgenology, 204(1), W52-57. https://doi.org/10.2214/AJR.14.12852
Claxton, L. D. (2005). Scientific authorship. Part 2. History, recurring issues, practices, and guidelines. Mutation Research/reviews in Mutation Research, 589(1), 31–45. https://doi.org/10.1016/j.mrrev.2004.07.002
Covidsurg Collaborative GC. (2021). SARS-CoV-2 vaccination modelling for safe surgery to save lives: Data from an international prospective cohort study. British Journal of Surgery, 108(9), 1056–1063. https://doi.org/10.1093/bjs/znab101
Cronin, B. (1996). Research brief rates of return to citation. Journal of Documentation, 52(2), 188–197. https://doi.org/10.1108/eb026967
Cronin, B. (2001). Hyperauthorship: A postmodern perversion or evidence of a structural shift in scholarly communication practices? JASIST, 52(7), 558–569. https://doi.org/10.1002/asi.1097
Dhingra, D., & Mishra, D. (2014). Publication misconduct among medical professionals in India. Indian Journal of Medical Ethics, 11(2), 104–107. https://doi.org/10.20529/IJME.2014.026
Dong, Y., Wang, P., Guo, L., & Liu, H. (2016). “Listing author contribution” does not alter the author inflation in the publications in basic research in four major gastroenterology journals in 10 years. Scientometrics, 107(3), 1501–1507. https://doi.org/10.1007/s11192-016-1923-4
Dotson, B., McManus, K. P., Zhao, J. J., & Whittaker, P. (2011). Authorship and characteristics of articles in pharmacy journals: Changes over a 20-year interval. Annals of Pharmacotherapy, 45(3), 357–363. https://doi.org/10.1345/aph.1P610
Drenth, J. P. H. (1996). Proliferation of authors on research reports in medicine. Science and Engineering Ethics, 2(4), 469–480. https://doi.org/10.1007/BF02583933
Drenth, J. P. (1998). Multiple authorship: The contribution of senior authors. JAMA, 280(3), 219–221. https://doi.org/10.1001/jama.280.3.219
Durani, P., Rimouche, S., & Ross, G. (2007). ’How many plastic surgeons does it take to write a research article?—authorship proliferation in and internationalisation of the plastic surgery literature. Journal of Plastic, Reconstructive & Aesthetic Surgery, 60(8), 956–957. https://doi.org/10.1016/j.bjps.2006.08.002
Elsevier. (2023). Content coverage. Retrieved August 2, from https://www.elsevier.com/solutions/scopus/how-scopus-works/content
Epstein, R. J. (1993). Six authors in search of a citation: Villains or victims of the Vancouver convention? BMJ, 306(6880), 765–767. https://doi.org/10.1136/bmj.306.6880.765
Ferguson, C., Marcus, A., & Oransky, I. (2014). Publishing: The peer-review scam. Nature, 515(7528), 480–482. https://doi.org/10.1038/515480a
Fernandes, J. M., & Cortez, P. (2020). Alphabetic order of authors in scholarly publications: A bibliometric study for 27 scientific fields. Scientometrics, 125(3), 2773–2792. https://doi.org/10.1007/s11192-020-03686-0
Flanagin, A., Carey, L. A., Fontanarosa, P. B., Phillips, S. G., Pace, B. P., Lundberg, G. D., & Rennie, D. (1998). Prevalence of articles with honorary authors and ghost authors in peer-reviewed medical journals. JAMA, 280(3), 222–224. https://doi.org/10.1001/jama.280.3.222
Greene, M. (2007). The demise of the lone author. Nature, 450(7173), 1165. https://doi.org/10.1038/4501165a
Grieger, M. C. (2005). Authorship: An ethical dilemma of science. Sao Paulo Medical Journal, 123(5), 242–246. https://doi.org/10.1590/S1516-31802005000500008
Grobbee, D. E., & Allpress, R. (2016). On scientific authorship: Proliferation, problems and prospects. European Journal of Preventive Cardiology, 23(8), 790–791. https://doi.org/10.1177/2047487316642383
Gu, A., Almeida, N., Cohen, J. S., Peck, K. M., & Merrell, G. A. (2017). Progression of authorship of scientific articles in the Journal of Hand Surgery, 1985–2015. The Journal of Hand Surgery. https://doi.org/10.1016/j.jhsa.2017.01.005
Hsu, A. L., Konner, M., Muttreja, A., Lee, C. H., Chien, J. L., & Irish, R. D. (2021). A comprehensive analysis of authorship trends in Skeletal Radiology since inception from 1976 to 2020. Skeletal Radiology, 50(12), 2519–2523. https://doi.org/10.1007/s00256-021-03810-y
ICMJE. (2022). Recommendations for the Conduct, Reporting, Editing, and Publication of Scholarly Work in Medical Journals. nternational Committee of Medical Journal Editors. Retrieved October 17, from https://www.icmje.org/recommendations/
Kans, J. (2022). Entrez Direct: E-utilities on the Unix Command Line. National Center of Biotechnology Information (NCBI). Retrieved February 11, from https://www.ncbi.nlm.nih.gov/books/NBK179288/
Kennedy, M. S., Barnsteiner, J., & Daly, J. (2014). Honorary and ghost authorship in nursing publications. Journal of Nursing Scholarship, 46(6), 416–422. https://doi.org/10.1111/jnu.12093
Khachatryan, V., Sirunyan, A. M., Tumasyan, A., Adam, W., Bergauer, T., Dragicevic, M., Ero, J., Fabjan, C., Friedl, M., Fruhwirth, R., Ghete, V. M., Hammer, J., Hansel, S., Hoch, M., Hormann, N., Hrubec, J., Jeitler, M., Kasieczka, G., Kiesenhofer, W.,… Weinberg, M. (2010). First measurement of Bose-Einstein correlations in proton-proton collisions at radicals = 0.9 and 2.36 TeV at the LHC. Physical Review Letters. 105(3), 032001. https://doi.org/10.1103/PhysRevLett.105.032001
King, J. T., Jr. (2000). How many neurosurgeons does it take to write a research article? Authorship proliferation in neurosurgical research. Neurosurgery, 47(2), 435–440. https://doi.org/10.1097/00006123-200008000-00032
Knudson, D. (2012). Twenty-year trends of authorship and sampling in applied biomechanics research. Perceptual and Motor Skills, 114(1), 16–20. https://doi.org/10.2466/11.PMS.114.1.16-20
Kornhaber, R. A., McLean, L. M., & Baber, R. J. (2015). Ongoing ethical issues concerning authorship in biomedical journals: An integrative review. International Journal of Nanomedicine, 10, 4837–4846. https://doi.org/10.2147/IJN.S87585
Larivière, V., Gingras, Y., Sugimoto, C. R., & Tsou, A. (2015). Team size matters: Collaboration and scientific impact since 1900. Journal of the Association for Information Science and Technology, 66(7), 1323–1332. https://doi.org/10.1002/asi.23266
Lee, S. S. (2009). Authorship: Pride and proliferation. Liver International, 29(4), 477. https://doi.org/10.1111/j.1478-3231.2009.01978.x
Leung, W., Shaffer, C. D., Reed, L. K., Smith, S. T., Barshop, W., Dirkes, W., Dothager, M., Lee, P., Wong, J., Xiong, D., Yuan, H., Bedard, J. E., Machone, J. F., Patterson, S. D., Price, A. L., Turner, B. A., Robic, S., Luippold, E. K., McCartha, S. R.,… Elgin, S. C. (2015). Drosophila muller f elements maintain a distinct set of genomic properties over 40 million years of evolution. Bethesda, 5(5), 719–740. https://doi.org/10.1534/g3.114.015966
Levsky, M. E., Rosin, A., Coon, T. P., Enslow, W. L., & Miller, M. A. (2007). A descriptive analysis of authorship within medical journals, 1995–2005. Southern Medical Journal, 100(4), 371–375. https://doi.org/10.1097/01.smj.0000257537.51929.4b
Liesegang, T. J., Schachat, A. P., & Albert, D. M. (2010). Defining authorship for group studies. Archives of Ophthalmology, 128(8), 1071–1072. https://doi.org/10.1001/archophthalmol.2010.159
Lin, Z. (2023). Modernizing authorship criteria: Challenges from exponential authorship inflation and generative artificial intelligence. Preprint. https://doi.org/10.31234/osf.io/s6h58
Lin, Z., & Lu, S. (2023). Exponential authorship inflation in neuroscience and psychology from the 1950s to the 2020s. American Psychologist. In press. https://doi.org/10.31234/osf.io/vfz9q
Lutnick, E., Cusano, A., Sing, D., Curry, E. J., & Li, X. (2021). Authorship proliferation of research articles in top 10 orthopaedic journals: A 70-year analysis. Journal of the American Academy of Orthopaedic Surgeons Global Research and Reviews. https://doi.org/10.5435/JAAOSGlobal-D-21-00098
Martyn, C. (2003). Fabrication, falsification and plagiarism. QJM, 96(4), 243–244. https://doi.org/10.1093/qjmed/hcg036
Marusic, A., Bosnjak, L., & Jeroncic, A. (2011). A systematic review of research on the meaning, ethics and practices of authorship across scholarly disciplines. PLoS ONE, 6(9), e23477. https://doi.org/10.1371/journal.pone.0023477
Miles, S., Renedo, A., & Marston, C. (2022). Reimagining authorship guidelines to promote equity in co-produced academic collaborations. Global Public Health, 17(10), 2547–2559. https://doi.org/10.1080/17441692.2021.1971277
Modi, P., Hassan, A., Teng, C. J., & Chitwood, W. R., Jr. (2008). “How many cardiac surgeons does it take to write a research article?” Seventy years of authorship proliferation and internationalization in the cardiothoracic surgical literature. Journal of Thoracic and Cardiovascular Surgery, 136(1), 4–6. https://doi.org/10.1016/j.jtcvs.2007.12.057
NIH–NLM. (2020). Number of authors per MEDLINE®/PubMed® citation. National Institute of Health–National Library of Medicine. Retrieved January 11, from https://www.nlm.nih.gov/bsd/authors1.html#collective
Ojerholm, E., & Swisher-McClure, S. (2015). Authorship in radiation oncology: proliferation trends over 30 years. International Journal of Radiation Oncology Biology Physics, 93(4), 754–756. https://doi.org/10.1016/j.ijrobp.2015.07.2289
Pell, H. (2019). From lone genius to wisdom of the crowd: Hyperauthorship in high-energy and astrophysics. Retrieved January 31, from https://www.aip.org/history-programs/niels-bohr-library/ex-libris-universum/lone-genius-wisdom-crowd-hyperauthorship#_ftnref10
Pintér, A. (2013). Changing trends in authorship patterns in the JPS: Publish or perish. Journal of Pediatric Surgery, 48(2), 412–417. https://doi.org/10.1016/j.jpedsurg.2012.10.069
Rahman, M. T., Regenstein, J. M., Abu Kassim, N. L., & Karim, M. M. (2021). Contribution based author categorization to calculate author performance index. Accountability in Research, 28(8), 492–516. https://doi.org/10.1080/08989621.2020.1860764
Reisig, M. D., Holtfreter, K., & Berzofsky, M. E. (2020). Assessing the perceived prevalence of research fraud among faculty at research-intensive universities in the USA. Accountability in Research, 27(7), 457–475. https://doi.org/10.1080/08989621.2020.1772060
Sayers, E. (2017). A general introduction to the E-utilities. National Center for Biotechnology Information (NCBI). Retrieved March 03, from https://www.ncbi.nlm.nih.gov/books/NBK25497/
Seetharam, A., Ali, M. T., Wang, C. Y., Schultz, K. E., Fischer, J. P., Lunsford, S., Whipple, E. C., Loder, R. T., & Kacena, M. A. (2018). Authorship trends in the Journal of Orthopaedic Research: A bibliometric analysis. Journal of Orthopaedic Research, 36(11), 3071–3080. https://doi.org/10.1002/jor.24054
Shah, A., Rajasekaran, S., Bhat, A., & Solomon, J. M. (2018). Frequency and factors associated with honorary authorship in Indian Biomedical Journals: Analysis of papers published from 2012 to 2013. Journal of Empirical Research on Human Research Ethics, 13(2), 187–195. https://doi.org/10.1177/1556264617751475
Shapiro, D. W., Wenger, N. S., & Shapiro, M. F. (1994). The contributions of authors to multiauthored biomedical research papers. JAMA, 271(6), 438–442. https://doi.org/10.1001/jama.1994.03510300044036
Sharma, H., & Verma, S. (2018). Authorship in biomedical research: A sweet fruit of inspiration or a bitter fruit of trade. Tropical Parasitology, 8(2), 62–69. https://doi.org/10.4103/tp.TP_27_18
Sheridan, G., Wisken, E., Hing, C. B., & Smith, T. O. (2018). A bibliometric analysis assessing temporal changes in publication and authorship characteristics in The Knee from 1996 to 2016. The Knee, 25(2), 213–218. https://doi.org/10.1016/j.knee.2018.01.014
Singh Chawla, D. (2019). Hyperauthorship: Global projects spark surge in thousand-author papers. Nature. https://doi.org/10.1038/d41586-019-03862-0
Singh Chawla, D. (2020). The gift of paper authorship—researchers seek clearer rules on crediting co-authors. Retrieved July 14, from https://www.nature.com/nature-index/news/gift-ghost-authorship-what-researchers-need-to-know
Slone, R. M. (1996). Coauthors’ contributions to major papers published in the AJR: Frequency of undeserved coauthorship. American Journal of Roentgenology, 167(3), 571–579. https://doi.org/10.2214/ajr.167.3.8751654
Smith, R. (1997). Authorship: Time for a paradigm shift? BMJ, 314(7086), 992. https://doi.org/10.1136/bmj.314.7086.992
Strange, K. (2008). Authorship: Why not just toss a coin? American Journal of Physiology-Cell Physiology, 295(3), C567-575. https://doi.org/10.1152/ajpcell.00208.2008
Sugrue, C. M., & Carroll, S. M. (2015). Authorship proliferation in hand surgery research: How many hand surgeons does it take to write a research article? Journal of Hand and Microsurgery, 7(1), 108–109. https://doi.org/10.1007/s12593-015-0175-5
Thelwall, M., & Maflahi, N. (2022). Research coauthorship 1900–2020: Continuous, universal, and ongoing expansion. Quantitative Science Studies, 3(2), 331–344. https://doi.org/10.1162/qss_a_00188
Tilak, G., Prasad, V., & Jena, A. B. (2015). Authorship inflation in medical publications. Inquiry. https://doi.org/10.1177/0046958015598311
Varghese, J., & Jacob, M. V. (2022). Gift authorship: Look the gift horse in the mouth. Indian Journal of Medical Ethics. https://doi.org/10.20529/ijme.2022.028
Weeks, W. B., Wallace, A. E., & Kimberly, B. C. (2004). Changes in authorship patterns in prestigious US medical journals. Social Science and Medicine, 59(9), 1949–1954. https://doi.org/10.1016/j.socscimed.2004.02.029
Weinberg, A. M. (1961). Impact of large-scale science on the United States: Big science is here to stay, but we have yet to make the hard financial and educational choices it imposes. Science, 134(3473), 161–164. https://doi.org/10.1126/science.134.3473.161
Wislar, J. S., Flanagin, A., Fontanarosa, P. B., & Deangelis, C. D. (2011). Honorary and ghost authorship in high impact biomedical journals: A cross sectional survey. BMJ, 343, d6128. https://doi.org/10.1136/bmj.d6128
Wuchty, S., Jones, B. F., & Uzzi, B. (2007). The increasing dominance of teams in production of knowledge. Science, 316(5827), 1036–1039. https://doi.org/10.1126/science.1136099
Funding
Open access funding provided by Paracelsus Medical University.
Author information
Authors and Affiliations
Contributions
Conception and design of the work: MJ 40%, EK 20%, TK 40%; acquisition, analysis of data: MJ 75%, EK 25%; interpretation of data: MJ 75%, TK 25%. Drafting and critically revising the work for important intellectual content: MJ 75%, TK 25%. Approval of the version to be published: MJ 40%, EK 20% and TK 40%. Accountability for all aspects of the work: MJ 50%, EK 10% and TK 40%.
Corresponding author
Ethics declarations
Conflict of interest
The authors have no relevant financial or non-financial interests to disclose.
Additional information
Publisher's Note
Springer Nature remains neutral with regard to jurisdictional claims in published maps and institutional affiliations.
The manuscript of this study constitutes the empirical part of the master thesis of the first author as part of his university course ‘Health Sciences and Leadership’ at the Paracelsus Medical University (submitted in May 2022).
Supplementary Information
Below is the link to the electronic supplementary material.
11192_2024_4928_MOESM1_ESM.tiff
Supplementary file 1 (TIFF 916 KB) Median author numbers per publication over time. For all 13 publication types, cumulative (Overall) and for single publication types
11192_2024_4928_MOESM2_ESM.xlsx
Supplementary file 2 (XLSX 17 KB) Regressions for mean author numbers (arithmetic mean) per publication over time. For all 13 publication types, cumulative (Overall) and for single publication types. RCT, randomized controlled trial. Best fits with confidence bands are shown along with r2 and R2 values for linear- and non-linear fits, respectively
Rights and permissions
Open Access This article is licensed under a Creative Commons Attribution 4.0 International License, which permits use, sharing, adaptation, distribution and reproduction in any medium or format, as long as you give appropriate credit to the original author(s) and the source, provide a link to the Creative Commons licence, and indicate if changes were made. The images or other third party material in this article are included in the article's Creative Commons licence, unless indicated otherwise in a credit line to the material. If material is not included in the article's Creative Commons licence and your intended use is not permitted by statutory regulation or exceeds the permitted use, you will need to obtain permission directly from the copyright holder. To view a copy of this licence, visit http://creativecommons.org/licenses/by/4.0/.
About this article

Cite this article
Jakab, M., Kittl, E. & Kiesslich, T. How many authors are (too) many? A retrospective, descriptive analysis of authorship in biomedical publications. Scientometrics 129, 1299–1328 (2024). https://doi.org/10.1007/s11192-024-04928-1
Received:
Accepted:
Published:
Issue Date:
DOI: https://doi.org/10.1007/s11192-024-04928-1