The team at our affiliated broker-dealer, RM Securities, conducts diligence on of the issuer, including detailed background checks, criminal checks, bad actor checks, and reference checks on sponsors. In addition to screening for any criminal background, we may also turn down sponsors due to poor reference checks, even if the background and criminal checks are satisfactory.
We require unaffiliated sponsors to use an unaffiliated third-party escrow agent.* When an investor makes an investment with such sponsors using the RealtyMogul platform, the investor’s money is transferred directly into a third-party escrow account. All closing conditions in connection with a sponsor’s contingency offering need to be met before the third-party escrow agent will approve releasing investor funds to the issuer or general partner. For example, if an issuer or general partner plans to use funds for a real estate acquisition that does not ultimately transact, the third-party escrow agent will not transfer investor funds to the issuer or general partner, and funds will be returned to investors.
* Unless otherwise disclosed, escrow accounts are not required for some investments that accommodate 1031 investments where the property is already acquired.
Our processes typically includes visiting certain properties (or a subset of properties if it's a fund) to confirm the real estate is what and where the real estate is supposed to be. For certain properties that accommodate 1031 exchange investments, the team will review third-party prepared due diligence reports in lieu of a site visit.
We have formalized processes and checklists for every private placement deal listed on the platform.


Haverford Place, built in 2001, is primed for a value-add business plan. The submarket has exhibited strong demand for premium finishes. The Property is positioned to capture premiums to current rental rates through higher-end interior upgrades such as granite counters, backsplashes, flooring, upgraded lighting and fixtures, and other interior upgrades.

Haverford Place is comprised of 73% large two- and three-bedroom townhomes, which are desirable in this submarket. The unit sizes at Haverford Place are on average 259 SF larger than other nearby comparable properties. Larger unit sizes are highly sought-after due to the increased prevalence of remote working.

Georgetown, KY has seen significant development through recent investment in the Toyota manufacturing plant and public infrastructure throughout the city. There have been new developments such as shopping centers and dining options. Additionally, the submarket is home to Georgetown College, multiple historical reserves and museums, and state-renowned Scott County Community Park.
RM Communities
RM Communities is an owner/operator of multifamily assets with a proprietary playbook to deliver strong risk-adjusted returns. RM Communities acquired its first investment in May of 2019 and has since grown to nearly 2,000 multifamily units and over $300 million in real estate with a fully dedicated team of acquisitions, underwriting and asset management professionals.
RM Communities is a sister-company to RealtyMogul, one of the leading real estate crowdfunding platforms. After working with third party operating partners for 10+ years at RealtyMogul, we observed how the best operators stood out – their processes, acquisition targets, execution models, reporting materials and communication styles that informed our strategic objectives for RM Communities. Today, we execute against that playbook as we seek to deliver strong risk-adjusted returns across a variety of multifamily opportunities.
RM Communities 2023 Outlook Webinar
Todd Hanson, Managing Director of RM Communities, discussed the RM Communities portfolio performance and also provided his 2023 strategic outlook. This discussion included his thoughts on multifamily risks and opportunities and how best to navigate the 2023 investment environment. Watch the Webinar
-
 Todd HansonManaging Director
 -
 Derek JensenDirector of Acquisitions, West & Florida
 -
 Daniel WeisbergerAssistant Vice President of Acquisitions
Todd Hanson is the Managing Director for RM Communities across the US and has responsibility for planning and execution of overall strategy and directing the investment and financing activities of the company. He is actively involved in maintaining existing client relationships and developing new capital and partnership opportunities for the company. Mr. Hanson was previously EVP and Head of Investments at The ConAm Group, a private equity multifamily investment firm.
Derek Jensen is a Director of Acquisitions for RM Communities, the direct acquisition arm of RealtyMogul, and has responsibility for overseeing direct acquisitions of multifamily opportunities in the western half of the United States. Mr. Jensen has over 20 years of real estate experience, concentrated in the acquisition, management and disposition of over 10,000 multifamily units including market rate, value-add, affordable housing and fractured condominiums. Mr. Jensen has held positions at several private and institutional firms including Pacifica Companies and GFI Partners.
Daniel Weisberger is an Assistant Vice President of Acquisitions for RM Communities, responsible for direct acquisitions of multifamily opportunities. Mr. Weisberger has experience in the real estate and financial services industries having transacted and advised on over $15 billion of real estate debt and equity investments. He was previously a Development Analyst at a national multifamily developer and a Senior Associate at PricewaterhouseCoopers in the Real Estate Valuation and Transaction Advisory group. Mr. Weisberger is a licensed Certified Public Accountant.
| Property Name | Location | Multifamily Class | No. of Units | Year Built | Purchase Price | CapEx Budget | Status |
| Terrace Hill | El Paso, TX | B | 310 | 1983 | $18,700,000 | $4,095,000 | Full Cycle. 22% deal-level IRR, 18% LP-level IRR* |
| La Privada | El Paso, TX | B | 240 | 1982 | $11,700,000 | $1,867,000 | Closed |
| The Hamptons | Virginia Beach, VA | B | 212 | 1973 | $19,051,000 | $3,792,000 | Closed |
| Pohlig Box Factory & Superior Warehouse | Richmond, VA | A- | 93 & 7,700 Retail SF | 2004 | $15,900,000 | $1,348,000 | Closed |
| Lubbock Medical Office Building | Lubbock, TX | B | 20,880 SF | 1966 | $8,350,000 | $0 | Closed |
| Turtle Creek | Fenton, MO | A- | 128 | 2018 | $24,875,000 | $596,000 | Closed |
| The Orion | Orion Township, MI | B+ | 200 | 1995 | $27,375,000 | $2,308,000 | Closed |
| Kings Landing | Creve Coeur, MO | A- | 152 & 9,229 Retail SF | 2005 | $40,100,000 | $3,885,850 | Closed |
| Minnehaha Meadows | Vancouver, WA | A | 49 | 2021 | $16,450,000 | $83,950 | Closed |
| Roosevelt Commons | Vancouver, WA | A | 36 | 2020 | $12,550,000 | $78,200 | Closed |
| Bentley Apartments | Grove City, OH | A- | 138 | 2020 | $30,200,000 | $650,000 | Closed |
| Sherwood Oaks | Riverview, FL | B | 199 | 1984 | $35,000,000 | $1,266,725 | Closed |
| Haverford Place | Georgetown, KY | A- | 160 | 2001 | $31,050,000 | $2,836,734 | Closed |
| Edison Apartments | Gresham, OR | A | 64 | 2020 | $19,500,000 | $203,390 | Closed |
| Ridgeline View Townhomes | Vancouver, WA | A | 50 | 2022 | $18,100,000 | $37,500 | Pending |
| Brookside Apartments | Raleigh, NC | B | 68 | 1986 | $9,400,000 | $1,402,680 | Pending |
| Total | 2,099 | $319,601,000 | $23,049,752 |
The acquisitions of the Terrace Hill Apartments, La Privada, The Hamptons, and Pohlig Box Factory & Superior Warehouse properties preceded the formation of the RM Communities, LLC. Consequently, these real estate assets are managed by an affiliate of RM Communities, LLC. They are included as part of the RM Communities, LLC portfolio because these real estate assets were acquired and are managed under the same executive leadership in Jilliene Helman and according to the same investment strategy employed by RM Communities, LLC.
Note: Totals include Terrace Hill (sold).
*Past performance is not indicative of future performance.
The business plan consists of marking rents to market and implementing a value-add program. RM Communities plans to allocate approximately $12,000 per unit to upgrade the interior of all the units to include granite countertops, refreshed cabinet faces, backsplashes, new fixtures, upgraded lighting, new paint, and washers and dryers, among other interior upgrades. Additionally, RM Communities plans to allocate $620,000 for exterior and common area upgrades such as expanding the dog park, upgrading the clubhouse and pool area, adding package lockers, and curing deferred maintenance. RM Communities is projecting to increase rents by an average of $361 per unit over current in-place rents.
RM Communities plans to finance the acquisition of the Property with a 10-year, fixed-rate Freddie Mac Green loan with five years of interest-only at an estimated 69% LTV and 3.24% rate. Pursuant to the Green Up program, RM Communities is committing to an energy-saving and water conservation program through upgrades such as more efficient lighting and water-saving faucets and showerheads. Additionally, RM Communities plans to add a supplemental loan at the beginning of year 4 after the Property has been fully renovated to capture the value added and return capital to investors. The plan is to exit in 10 years at a projected 5.0% cap rate.
CapEx Breakdown
| Interior Upgrades | Total | Per Unit | No. Units | Cost of Upgrade |
| Appliances | $51,300 | $321 | 19 | $2,700 |
| Countertops | $560,000 | $3,500 | 160 | $3,500 |
| Backsplashes | $144,000 | $900 | 160 | $900 |
| Cabinets | $176,000 | $1,100 | 160 | $1,100 |
| Hardware | $48,000 | $300 | 160 | $300 |
| Lighting | $48,000 | $300 | 160 | $300 |
| Plumbing Fixtures | $48,000 | $300 | 160 | $300 |
| Ceiling Fans | $5,700 | $36 | 19 | $300 |
| Misc. / Materials | $160,000 | $1,000 | 160 | $1,000 |
| Flooring | $51,300 | $321 | 19 | $2,700 |
| Bathroom | $128,000 | $800 | 160 | $800 |
| Paint | $128,000 | $800 | 160 | $800 |
| Other Flooring | $112,800 | $705 | 141 | $800 |
| Green Program | $128,000 | $800 | 160 | $800 |
| Washers / Dryers | $160,000 | $1,000 | 160 | $1,000 |
| Total Interior Upgrades | $1,949,100 | $12,182 | $17,300 | |
| Exterior and Common Area Upgrades and Repairs | Total | Per Unit | ||
| Amenity | $40,000 | $250 | ||
| Roofs | $80,000 | $500 | ||
| HVAC Replacements / Water Heaters | $25,000 | $156 | ||
| Paint / Carpentry | $75,000 | $469 | ||
| Exterior Lighting | $10,000 | $63 | ||
| Landscaping & Drainage | $30,000 | $188 | ||
| Storage Shed | $20,000 | $125 | ||
| Concrete Work | $30,000 | $188 | ||
| Pool Renovation Incl. Furniture | $20,000 | $125 | ||
| Enhance Dog Park | $25,000 | $156 | ||
| Playground | $30,000 | $188 | ||
| Parking Lot Repairs | $25,000 | $156 | ||
| Package Lockers | $50,000 | $313 | ||
| Clubhouse / Business Center | $50,000 | $313 | ||
| Pergola, Benches, and Grills | $10,000 | $63 | ||
| Other | $100,000 | $625 | ||
| Total Exterior Common Area Upgrades and Repairs | $620,000 | $3,875 | ||
| Construction Management Fee | $128,455 | $803 | ||
| Contingency (10%) | $256,910 | $1,606 | ||
| Total CapEx | $2,954,465 | $18,465 |
Haverford Place, built in 2001, is a 160-unit apartment and townhome community. Haverford Place is in a growing suburb of Lexington, KY, and its employment driver is anchored by the largest Toyota manufacturing plant in the world.
The Property is comprised of one- and two-bedroom apartments and mostly two- and three-bedroom townhomes. Haverford Place has a clubhouse, pool and lounge area, fitness center, dog park, playground, and other amenities.
| Number | Type | Units | Unit SF | Total SF | In-Place Rent | Stabilized Rent | Stabilized Rent / SF |
| 1 | 1/1 | 32 | 900 | 28,800 | $916 | $1,300 | $1.44 |
| 2 | 2/2 | 12 | 1,000 | 12,000 | $1,016 | $1,365 | $1.37 |
| 3 | 2/1.5 Townhome | 68 | 1,268 | 86,224 | $1,088 | $1,445 | $1.14 |
| 4 | 3/2 Townhome | 40 | 1,369 | 54,760 | $1,274 | $1,625 | $1.19 |
| 5 | 2/1.5 Townhome Large | 8 | 1,400 | 11,200 | $1,137 | $1,510 | $1.08 |
| Total/Average | 160 | 1,206 | 192,984 | $1,097 | $1,458 | $1.21 |
Lease Comparables
| 1 Bedroom / 1 Bathroom | ||||
| Property | SF | Stabilized Rent | Per SF | YOC |
| Haverford Place | 900 | 1,300 | $1.44 | 2001 |
| The Mill | 698 | 1,300 | $1.86 | 2012 |
| The MarQ | 723 | 1,009 | $1.40 | 2017 |
| Comp Average | 711 | 1,155 | $1.62 | |
| 2 Bedroom / 2 Bathroom | ||||
| Property | SF | Stabilized Rent | Per SF | YOC |
| Haverford Place | 1,000 | 1,365 | $1.37 | 2001 |
| The MarQ | 1,160 | 1,212 | $1.04 | 2017 |
| Amerson Orchard | 921 | 1,184 | $1.29 | 2017 |
| The Mill (TH) (2/2) | 1,024 | 1,430 | $1.40 | 2012 |
| The Mill (2/2) | 924 | 1,320 | $1.43 | 2012 |
| Comp Average | 1,007 | 1,287 | $1.28 | |
| 2 Bedroom / 1.5 Bathroom Townhome | ||||
| Property | SF | Stabilized Rent | Per SF | YOC |
| Haverford Place | 1,268 | 1,445 | $1.14 | 2001 |
| The Mill (TH) (2/2.5) | 1,179 | 1,490 | $1.26 | 2012 |
| The Mill (TH) (2/2) | 1,024 | 1,430 | $1.40 | 2012 |
| Comp Average | 1,102 | 1,460 | $1.33 | |
| 3 Bedroom / 2 Bathroom Townhome | ||||
| Property | SF | Stabilized Rent | Per SF | YOC |
| Haverford Place | 1,369 | 1,625 | $1.19 | 2001 |
| The MarQ | 1,355 | 1,398 | $1.03 | 2017 |
| Amerson Orchard | 1,350 | 1,597 | $1.18 | 2017 |
| The Mill (3/2) | 1,665 | 1,900 | $1.14 | 2012 |
| Comp Average | 1,457 | 1,632 | $1.12 | |
Sales Comparables
| Property Name | Submarket Name | Property Address | City | Sale Date | Sale Price | Number of Units | Gross Building SF | Price Per Unit | Price Per SF | Year Built | Building Class |
| Haverford Place | North Lexington | 101 Haverford Path | Georgetown | 2/1/2022* | $31,050,000* | 160 | 193,664 | $194,063 | $160 | 2001 | A- |
| The Preserve Lexington | Red Mile | 845 Red Mile Rd | Lexington | 8/23/2021 | $36,350,000 | 181 | 209,300 | $200,829 | $174 | 1997 | B |
| Palomar View | Palomar | 4121 Reserve Rd | Lexington | 9/24/2019 | $22,500,000 | 140 | 92,000 | $160,714 | $245 | 2015 | A |
| The Henry at Fritz Farm | Southeast Lexington | 200 Larue | Lexington | 3/4/2019 | $62,190,000 | 306 | 275,000 | $203,235 | $226 | 2016 | A |
*Projected
Market Overview: Lexington MSA
Lexington, KY is a renowned and historic city, known for its distinct culture, deep horse-breeding traditions, and thriving workforce. Lexington remains the second most populous city in the state of Kentucky, with a large portion of its residents attending one of the many universities or colleges in the area. Lexington is home to the University of Kentucky, which enrolls over 30,000 students per year.
Lexington has also been deemed the horse-racing capital of the United States. Home to famous horse breeding parks and racing arenas, over 1.5 million people travel to the area to attend a selection of over 200 events annually.
Lexington’s economy has seen sharp growth throughout the last decade and continues to attract young professionals and private investment. The city is known for its attractive atmosphere, large parks, and dense urban nightlife. Lexington is home to unique and locally sourced dining experiences, college sports, and rich history of bourbon production. Lexington's stable economy continues to sustain growth for the city, and surrounding Fayette County.
Submarket Overview: Georgetown (North Lexington)
Located 15 miles from Downtown Lexington, Georgetown, KY is a growing and established suburban community known for being the home of the largest Toyota manufacturing plant in the world. The largest employment sectors in Georgetown are management, education, health diagnostics, and finance. Per CoStar, the median area income is $72k within a 5-mile radius of the property. Additionally, population growth in the 5-mile radius is projected to grow by 1.9% annually over the next five years.
The submarket has also experienced significant public and private investment and has a large construction pipeline waiting to be delivered. Large mixed-use developments, renovations of skilled nursing facilities, and the expansion of the city’s South Sewer treatment facility are a few of the upcoming projects waiting to be finished in the submarket. Georgetown has continued to attract new residents with the recent completion of the Lemon Mill Road Widening Project, and the Expansion of Lanes Run Business park – a comprehensive commercial and residential development spanning a 1-mile radius.


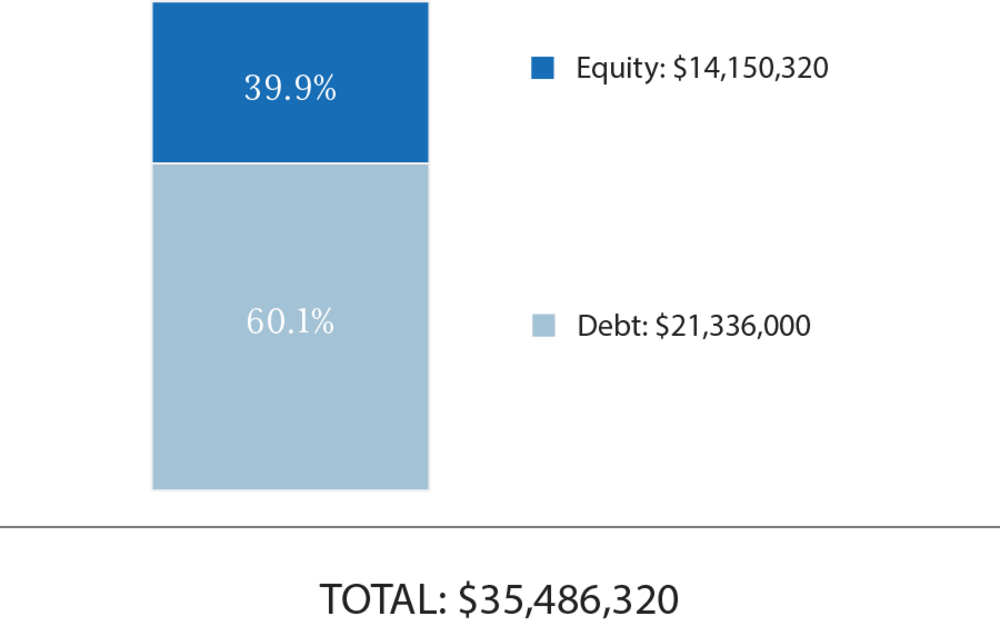
Total Capitalization
| Sources | Amount | $/Unit | % |
| Senior Loan | $21,336,000 | $133,350 | 60.1% |
| LP Investor Equity | $14,150,320 | $88,439 | 39.9% |
| Total | $35,486,320 | $221,789 | 100.0% |
| Uses | Amount | $/Unit | % |
| Purchase Price | $31,050,000 | $194,063 | 87.5% |
| Loan Fee | $160,020 | $1,000 | 0.5% |
| Closing, Legal Fees | $340,000 | $2,125 | 1.0% |
| CapEx Budget | $2,954,465 | $18,465 | 8.3% |
| Acquisition Fee | $621,000 | $3,881 | 1.7% |
| Taxes and Insurance | $173,227 | $1,083 | 0.5% |
| Working Capital | $130,000 | $813 | 0.4% |
| Interest & CF Reserve | $57,607 | $360 | 0.2% |
| Total | $35,486,320 | $221,789 | 100.0% |
The expected terms of the debt financing are as follows:
- Loan Type: Agency
- Total Loan Amount: $21,336,000
- Loan Term: 10 Years
- Lender: Freddie Mac
- Amortization: 30 Years
- Assumed Interest Rate: 3.24%
- Interest Type: Fixed
- Interest-Only: 5 Years
- Initial Loan-to-Purchase: 68.7%
- Loan-to-Cost: 62.7%*
- Extension Options: No
*LTC is based on Purchase Price and CapEx Budget
There can be no assurance that the Sponsor will secure debt on the rates and terms noted above, or at all. All of the Sponsor’s estimated rates and terms of the debt financing are subject to lender approval, including but not limited to possible increases in capital reserve requirements for funds to be held in a lender-controlled capital reserve account.
A substantial portion of the total acquisition for the Property will be paid with borrowed funds. The use of borrowed money to acquire real estate is referred to as leveraging. Leveraging increases the risk of loss. If the Sponsor were unable to pay the payments on the borrowed funds (called a "default"), the lender might foreclose, and the Sponsor could lose its investment in its property.
RM Communities intends to make distributions from Haverford Place Investors, LLC as follows:
Operating Cash Flow:
- To the Investors, pari passu, all operating cash flows to an 8.0% preferred return;
- 70% / 30% (70% to Investors / 30% to Promote) of excess cash flow to a 15% IRR;
- 50% / 50% (50% to Investors / 50% to Promote) of excess cash flow thereafter.
Capital Event:
- To the Investors, pari passu, all operating cash flows to an 8.0% preferred return;
- Return of Capital
- 70% / 30% (70% to Investors / 30% to Promote) of excess cash flow to a 15% IRR;
- 50% / 50% (50% to Investors / 50% to Promote) of excess cash flow thereafter.
RM Communities intends to make distributions to investors after the payment of both company's liabilities (loan payments, operating expenses, and other fees as more specifically set forth in the LLC agreements, in addition to any member loans or returns due on member loan).
Distributions are expected to start in August 2022 and are projected to continue on a quarterly basis thereafter. Distributions are at the discretion of RM Communities, who may decide to delay distributions for any reason, including maintenance or capital reserves.
| Cash Flow Summary | |||||||||||
| Year 1 | Year 2 | Year 3 | Year 4 | Year 5 | Year 6 | Year 7 | Year 8 | Year 9 | Year 10 | ||
| Effective Gross Income | $2,532,735 | $2,961,043 | $3,211,119 | $3,365,337 | $3,485,519 | $3,590,084 | $3,697,787 | $3,808,720 | $3,922,982 | $4,040,671 | |
| Expenses | $1,071,980 | $1,163,878 | $1,197,603 | $1,232,586 | $1,267,406 | $1,302,638 | $1,338,872 | $1,376,136 | $1,414,460 | $1,453,874 | |
| Net Operating Income | $1,460,755 | $1,797,165 | $2,013,516 | $2,132,750 | $2,218,113 | $2,287,446 | $2,358,914 | $2,432,584 | $2,508,522 | $2,586,797 | |
| Total Property Cash Flow | $731,477 | $1,061,463 | $1,274,063 | $9,360,308* | $956,915 | $603,103 | $672,957 | $744,962 | $819,186 | $27,018,398 | |
| Net Cash Flow to Investors(1) | $726,977 | $1,056,963 | $1,269,563 | $9,259,442* | $795,905 | $541,750 | $587,411 | $632,520 | $678,026 | $19,744,268 | |
| Projected Investor Cash Flow | |||||||||||
| Year 0 | Year 1 | Year 2 | Year 3 | Year 4 | Year 5 | Year 6 | Year 7 | Year 8 | Year 9 | Year 10 | |
| Investor-Level Cash Flows - Hypothetical $50,000 Investment(1) | ($50,000) | $2,569 | $3,735 | $4,486 | $32,718 | $2,812 | $1,914 | $2,076 | $2,235 | $2,396 | $69,766 |
*Projected proceeds of approximately $8.5 million from supplemental loan beginning in Year 4.
Note: Projected figures are 12-month periods starting in February 2022.
(1) Returns are net of all fees.
RM Technologies, LLC and its affiliates does not provide any assurance of returns. The content on this Page, including Sponsor’s pro forma projections, was provided by the Sponsor or an affiliate thereof. Although RM Technologies, LLC believes the Sponsor reliably produced this content, RM Technologies, LLC makes no representations or warranties as to the accuracy of such information and accepts no liability therefor. The assumptions and projections included in the content on this Page, including the Sponsor’s pro forma projections, are not reflective of the position of RM Technologies, LLC or any other person or entity other than the Sponsor or its affiliates. There can be no assurances that all or any of the Sponsor’s assumptions will be true, that actual performance will bear any relation to these hypothetical illustrations, or that the Sponsor’s investment objectives will be achieved. For additional information concerning the Sponsor’s assumptions and projections, and the significant risks involved in investing in real estate, please see the Disclaimers section below.
Certain fees and compensation will be paid over the life of the transaction; please refer to RM Communities' materials for details. The following fees and compensation will be paid(1):
| One-Time Fees | ||
| Type of Fee | Amount of Fee | Received By |
| Acquisition Fee | 2.0% of Purchase Price | RM Communities |
| Construction Management Fee | 5.0% of Capital Improvement Expenditures | Village Green, Third Party Property Manager |
| Recurring Fees | ||
| Type of Fee | Amount of Fee | Received By |
| Asset Management Fee | 1.5% of Effective Gross Income (EGI) | RM Communities |
| Property Management Fee | 3.0% of EGI and Incentive Fee if NOI Exceeds Budget | Village Green, Third Party Property Manager |
(1) Fees may be deferred to reduce impact to investor distributions.
RM Securities, LLC, its registered representatives, affiliates, associated persons, and personnel of its affiliates who may also be associated with it, including our associated persons and personnel of our affiliates who are also be associated with RM Securities, LLC (it (“RM Securities,” “we,” “our,” or “us”) will receive fees, expense reimbursements, and other compensation (“Fees”) from the issuer of this investment offering, its sponsor, or an affiliate thereof (“Sponsor”), or otherwise in connection with Sponsor’s offering. The Fees paid to us are in addition to other fees you will pay to Sponsor or in connection with Sponsor’s investment offering. You will pay Fees to Sponsor, either directly or indirectly as an investor in the Sponsor’s offering. Sponsor will use the Fees you pay, as well as funds you invest in the relevant offering, to compensate us. The Fees paid to us will directly or indirectly be borne by you as the investor (typically, but not always, in the form of an expense of the Sponsor’s offering in which you invest) because such Fees will reduce the proceeds available for distribution to you and reduce the amount you earn over time.
For more information on the Fees paid to us, or any other Fees you will pay in connection with Sponsor’s offering, please carefully review the Sponsor’s Investment Documents. Please also carefully review RM Securities’ Form CRS, Regulation Best Interest Disclosures, and Limited Brokerage Services Agreement.
No Approval, Opinion or Representation, or Warranty by RM Securities, LLCSponsor has provided, approved, and is solely responsible in all aspects for the information on this webpage (“Page”), including Sponsor’s offering documentation, which may include without limitation the Private Placement Memorandum, Operating or Limited Partnership Agreement, Subscription Agreement, the Project Summary and all exhibits and other documents attached thereto or referenced therein (collectively, the “Investment Documents”). The Investment Documents linked on this page have been prepared and posted by Sponsor, and not by RM Securities. We did not assist in preparing, do not adopt or endorse, and we are not otherwise responsible for, the Sponsor’s Investment Documents. We make no representations or warranties as to the accuracy of information on this Page or in the Sponsor’s Investment Documents and we accept no liability therefor. No part of the information on this Page or in the Sponsor’s Investment Documents is intended to be binding on us.
Sponsor’s Information Qualified by Investment DocumentsThe information on this Page is qualified in its entirety by reference to the more complete information about the offering contained in the Sponsor’s Investment Documents. The information on this Page is not complete and subject to change at the Sponsor’s discretion at any time up to the closing date. The Sponsor’s Investment Documents and supplements thereto contain important information about the Sponsor’s offering including relevant investment objectives, the business plan, risks, charges, expenses, and other information, which you should consider carefully before investing. The information on this Page should not be used as a basis for an investor’s decision to invest.
Risk of InvestmentThis investment is speculative, highly illiquid, and involves substantial risk. There can be no assurances that all or any of Sponsor’s assumptions, expectations, estimates, goals, hypothetical illustrations, or other aspects of Sponsor’s business plans (“Assumptions”) will be true or that actual performance will bear any relation to Sponsor’s Assumptions, and no guarantee or representation is made that Sponsor’s Assumptions will be achieved. If Sponsor does not achieve its Assumptions, your investment could be materially and adversely affected. A loss of part or all of the principal value of your investment may occur. You should not invest unless you can readily bear the consequences of such loss. Sponsor’s Assumptions should not be relied upon as the primary basis for your decision to invest.
No Reliance on Forward-Looking Statements; Sponsor AssumptionsSponsor is solely responsible for statements made concerning forward-looking statements and Assumptions, which apply only as of the date made, are preliminary and subject to change, and are expressly qualified in their entirety by the disclosures and cautionary statements included in Sponsor’s Investment Documents, which you should carefully review. Neither RM Securities nor Sponsor are obligated to update or revise such forward-looking statements or Assumptions to reflect events or circumstances that arise after the date made or to reflect the occurrence of unanticipated events. Sponsor’s forward-looking statements and Assumptions are hypothetical, not based on actual investment achievements or events, and are presented solely for purposes of providing insight into the Sponsor’s investment objectives, detailing Sponsor’s anticipated risk and reward characteristics, and establishing a benchmark for future evaluation of actual results; therefore, they are not a predictor, projection, or guarantee of future results. You should not rely on Sponsor’s forward-looking statements as a basis to invest.
Importantly, we do not adopt, endorse, or provide any assurance of returns or as to the accuracy or reasonableness of Sponsor’s Assumptions or forward-looking statements.
No Reliance on Past PerformanceAny description of past performance is not a reliable indicator of future performance and should not be relied upon as the primary basis to invest.
Sponsor’s Use of DebtA substantial portion of the total cost of the real estate asset acquired by the Sponsor with investor funds (“Property”) will be paid with borrowed funds, i.e., debt. Sponsor’s estimated rates and terms of the debt financing are subject to lender approval, and there is no assurance that the Sponsor will secure debt at the rates and terms presented on this Page or in the Sponsor’s Investment Documents, or at all. The use of borrowed money to acquire real estate is referred to as leveraging, which can amplify losses and could result in lender foreclosure. In addition, if the debt includes a variable (or “floating”) interest rate, the total amount of interest paid over the term of the debt will fluctuate and can increase. As a result, Sponsor’s use of debt can result in a loss of some or all of your investment.
Sponsor’s Offering is Not RegisteredSponsor’s securities offering will not be registered under the Securities Act of 1933, as amended (the “Securities Act”), in reliance upon the exemptions from registration pursuant to Rule 506(c) of Regulation D as promulgated under the Securities Act (“Private Placement”). In addition, the offering will not be registered under any state securities laws in reliance on exemptions from state registration. Such securities (your ownership interests) are subject to restrictions on transferability and resale and may not be transferred or resold except as permitted under applicable state and federal securities laws pursuant to registration or an available exemption. All Private Placements on the Platform are intended solely for “Accredited Investors,” as that term is defined in Rule 501(a) under the Securities Act.
No Investment AdviceNothing on this Page should be regarded as investment advice (either with respect to a particular security or regarding an overall investment strategy), a recommendation, an offer to sell, or a solicitation of or an offer to buy any security. Advice from a securities professional is strongly advised to understand and assess the risks associated with real estate or private placement investments. For additional information on RM Securities’ involvement in this offering, please carefully review the Sponsor’s Investment Documents, and RM Securities’ Form CRS, Regulation Best Interest Disclosures, and Limited Brokerage Services Agreement.
1031 Exchange RiskInternal Revenue Code Section 1031 (“Section 1031”) contains complex tax concepts and certain tax consequences may vary depending on the individual circumstances of each investor. RM Securities and its affiliates make no representation or warranty of any kind with respect to the tax consequences of your investment or that the IRS will not challenge any such treatment. You should consult with and rely on your own tax advisor about the tax aspects with respect to your particular circumstances.