How to get started with the Political Ads Transparency Report dataset
Bukola Ayodele
Developer Advocate
Steve Weiss
Product Manager
In 2022 we saw several major elections across the globe. And as many countries prepare for elections in 2023 and 2024, we’d like to re-introduce a set of transparency tools that Google provides in the election advertising space.
We know that election advertising is an important component of the democratic process – candidates use ads to raise awareness about their campaigns, share information and engage potential voters. And we want people to have confidence in election ads they see on our platforms. That’s why, in 2018, Google launched its Election Advertising Verification Policy, requiring all advertisers who wish to run election ads to complete a verification process. This includes checking and confirming an advertiser’s identity, and ensuring they meet certain eligibility requirements to run elections ads. We currently support election advertising verification in over 35 countries.
Using the information collected via this verification process, Google also released its Political Ads Transparency Report, which provides important insights and data about the ads published under our elections ads policy through Google Ads, YouTube and Google Display & Video 360.
In this blog post, we will explore the data available in the dataset, how to access it, and provide some examples of how it can be used. By the end of this post, you will have a better understanding of the valuable insights this information can provide. We encourage all readers to partner with us by using this data to drive greater accountability in the election advertising ecosystem.
Deeper dive into the dataset
Let’s dive deeper into what qualifies ads to be included in the Political Ads Transparency Report, and the data that is made available in the dataset.
The dataset contains information on election ads run by verified advertisers across Google Ads, YouTube and Google Display & Video 360. The definition of an election ad on Google varies based on the country or region in question. For example, in the United States, advertisers who wish to run ads that mention a US state-level or federal candidate or office holder, political party, or ballot measure, must complete our verification process verification process and the ads would subsequently appear in the Transparency Report.
The dataset– which begins in 2018 and retains ads for 7 years – includes the ads creatives themselves, as well as meaningful data on each ad, such as:
the audience that was targeted (advertisers can only target election ads on four broad categories: age, gender, contextual and general location)
how many users saw the ad, and
the money spent on the ad.
These features are a prime example of Google's commitment to transparency and accountability in the industry. Not only have journalists and research groups found the Transparency Report’s dataset incredibly useful for analyzing trends in election advertising spending, but this data and the disclosures that accompany it also help empower voters with reliable information about the election ads they may see on Google.
Accessing the election ads dataset
You can access this dataset in two ways: through a user-friendly interface and with SQL using the public dataset available in BigQuery.
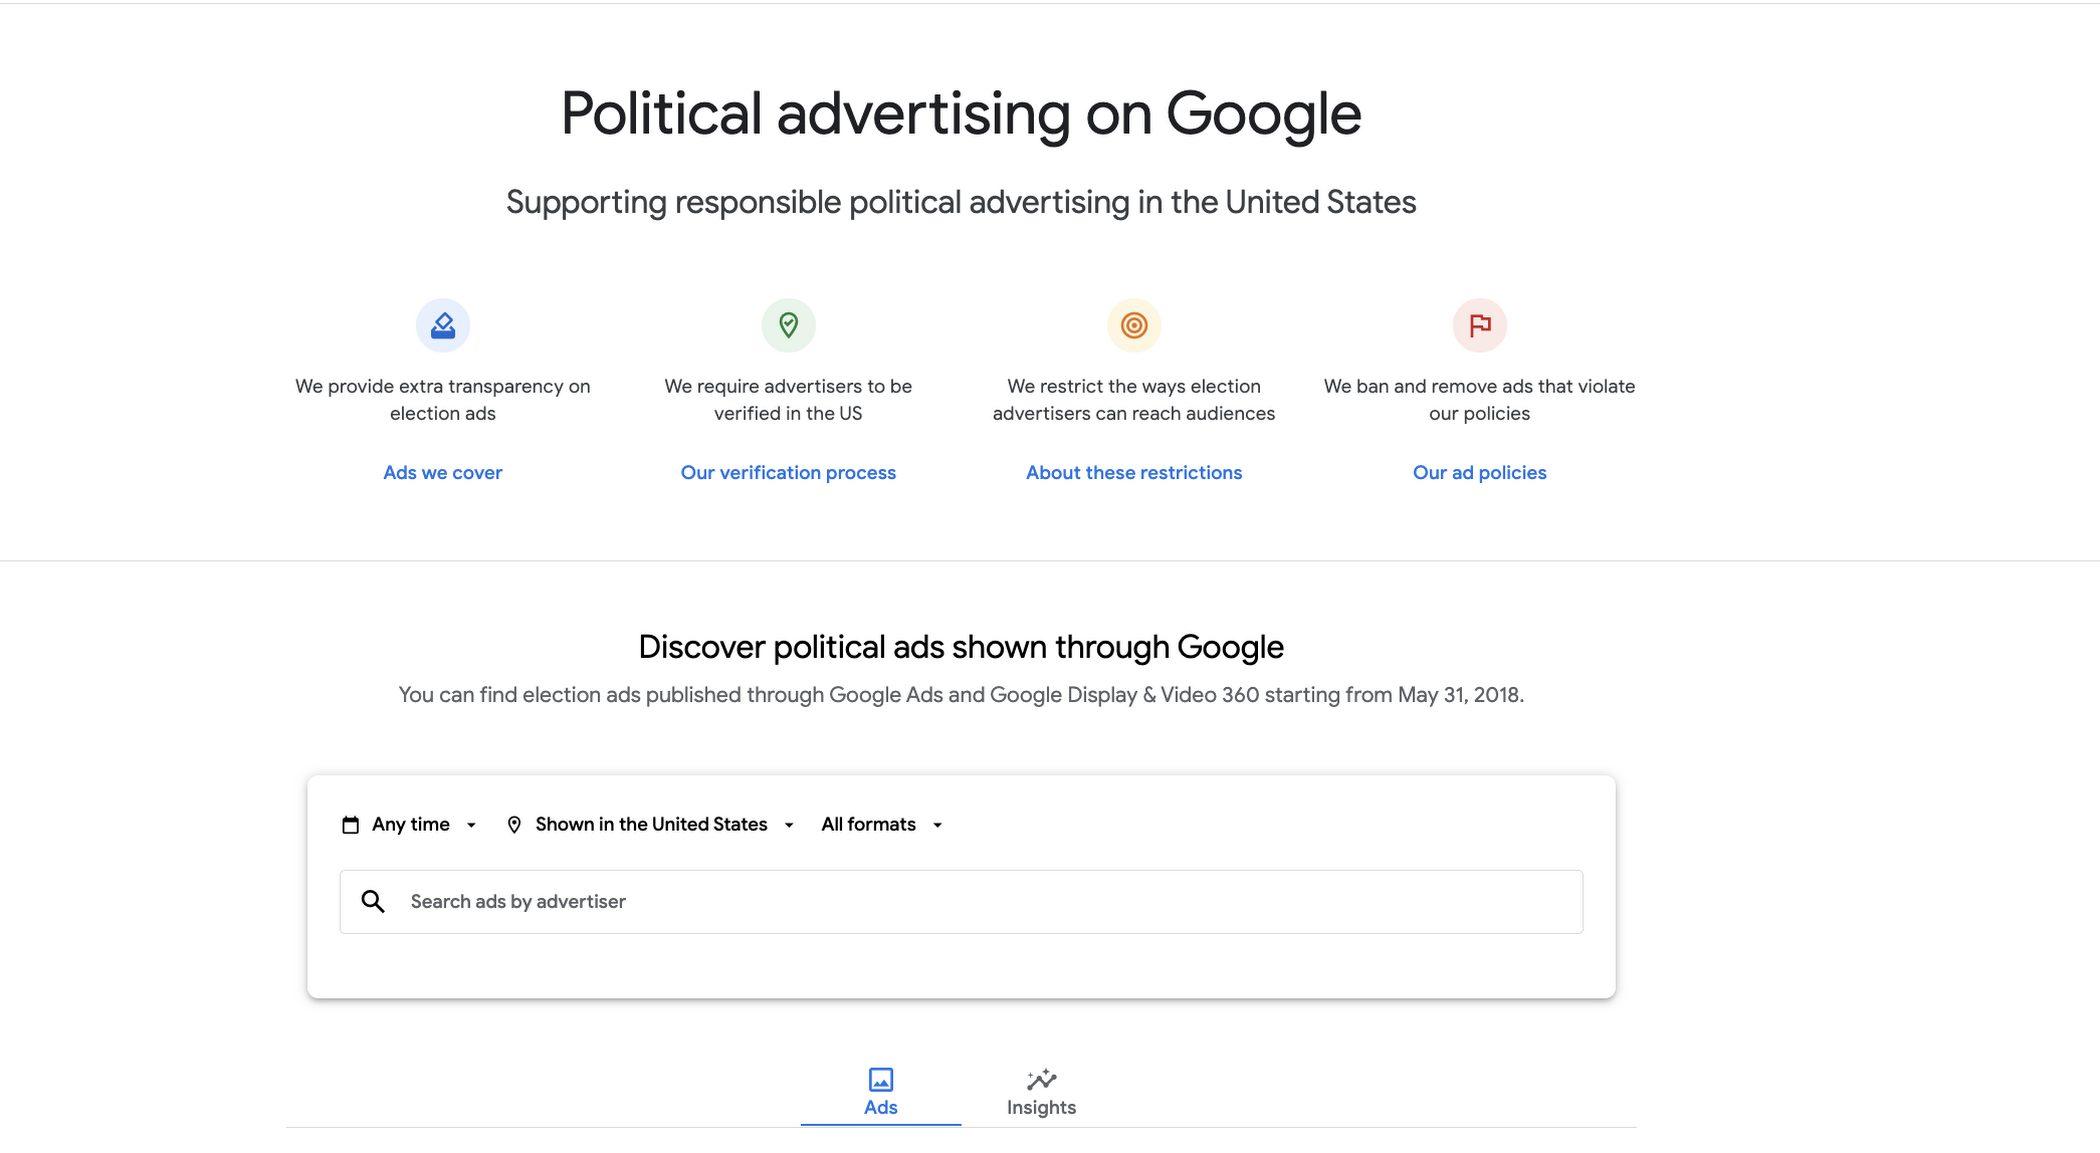
The interface, which was updated in 2022, includes an interactive drop-down tool that allows users to select and filter specific advertisers, candidates, locations, ad formats, and timeframes. It then displays the resulting ads and automatically produces insights in the form of easy-to-understand data visualizations, such as tables and charts. You can also create reports on an advertiser’s spend over time and spend by location. This can provide valuable insights into who is spending money on election ads and where investments are happening.
The BigQuery public dataset allows you to analyze the data using SQL, including the ability to join the data with other public datasets, or their own private data loaded in BigQuery. It also opens up the possibility to access the data via the BigQuery API, visualize the data in Looker Studio or Connected Sheets, or integrate the data for any number of purposes across the services of Google Cloud.
We’ll delve into a few example ways you can search using the UI and access and analyze the data in BigQuery.
Use cases for the election ads dataset
For research looking at ad dollars spent by location
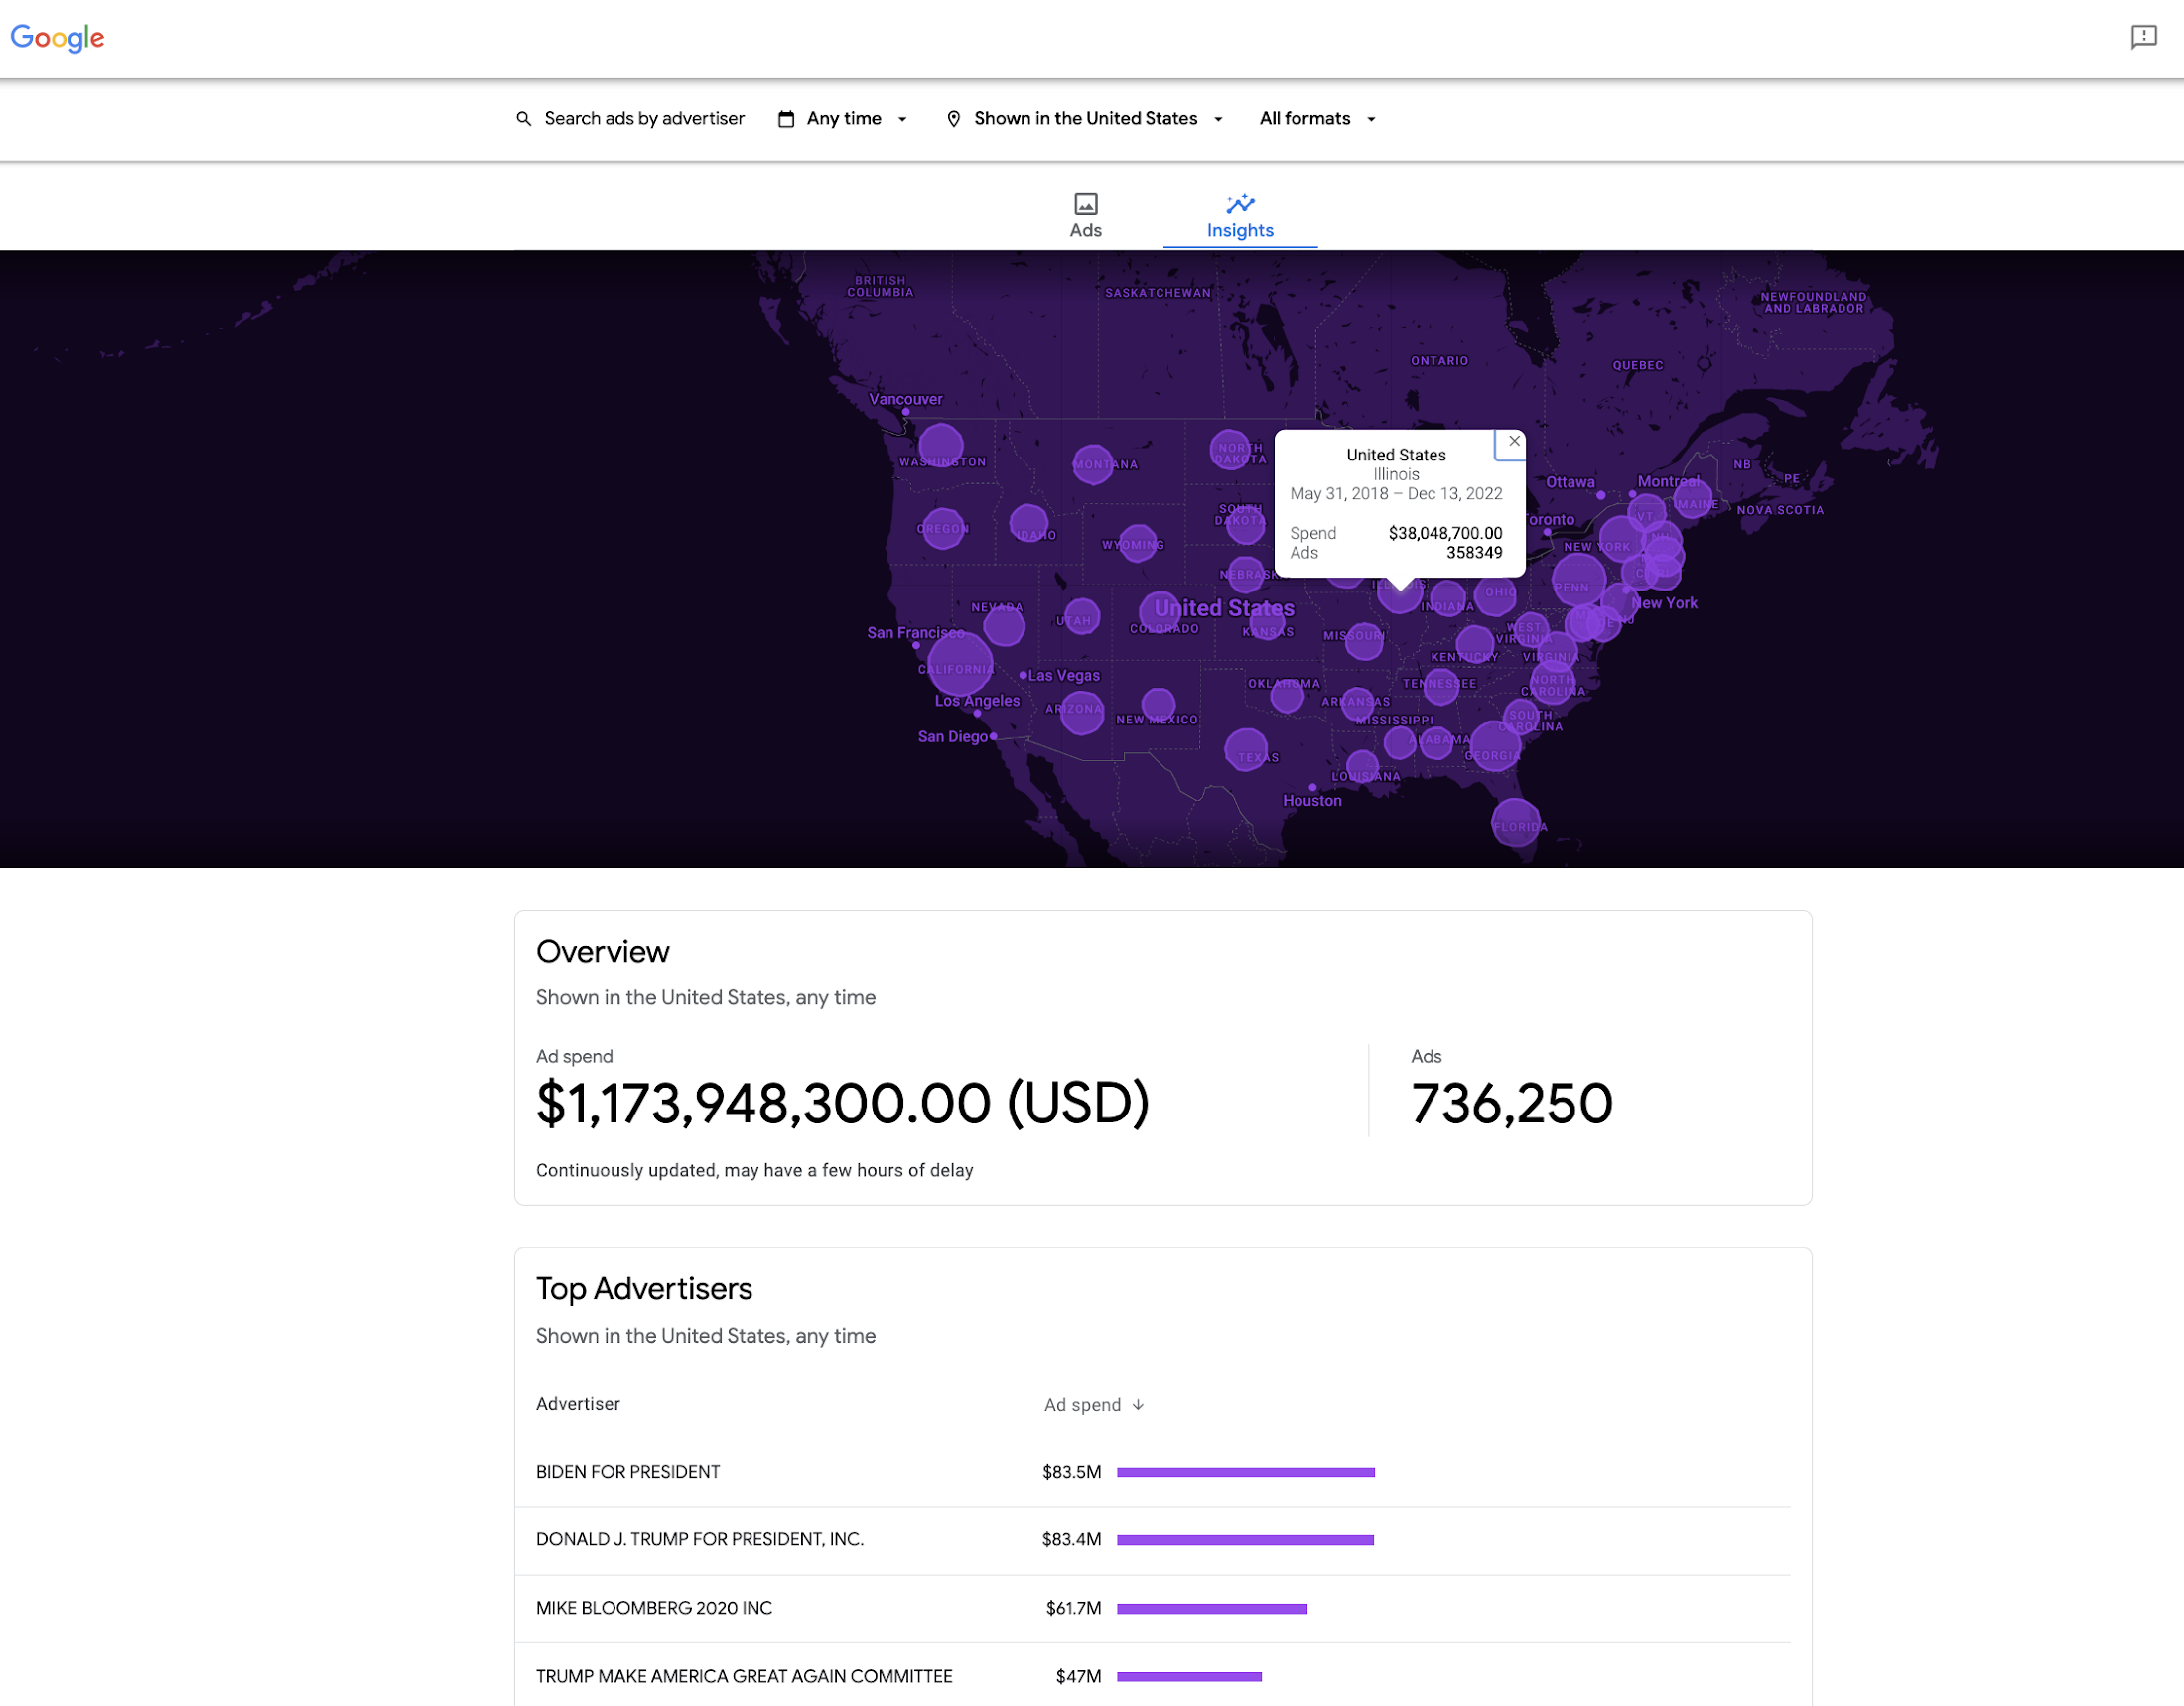
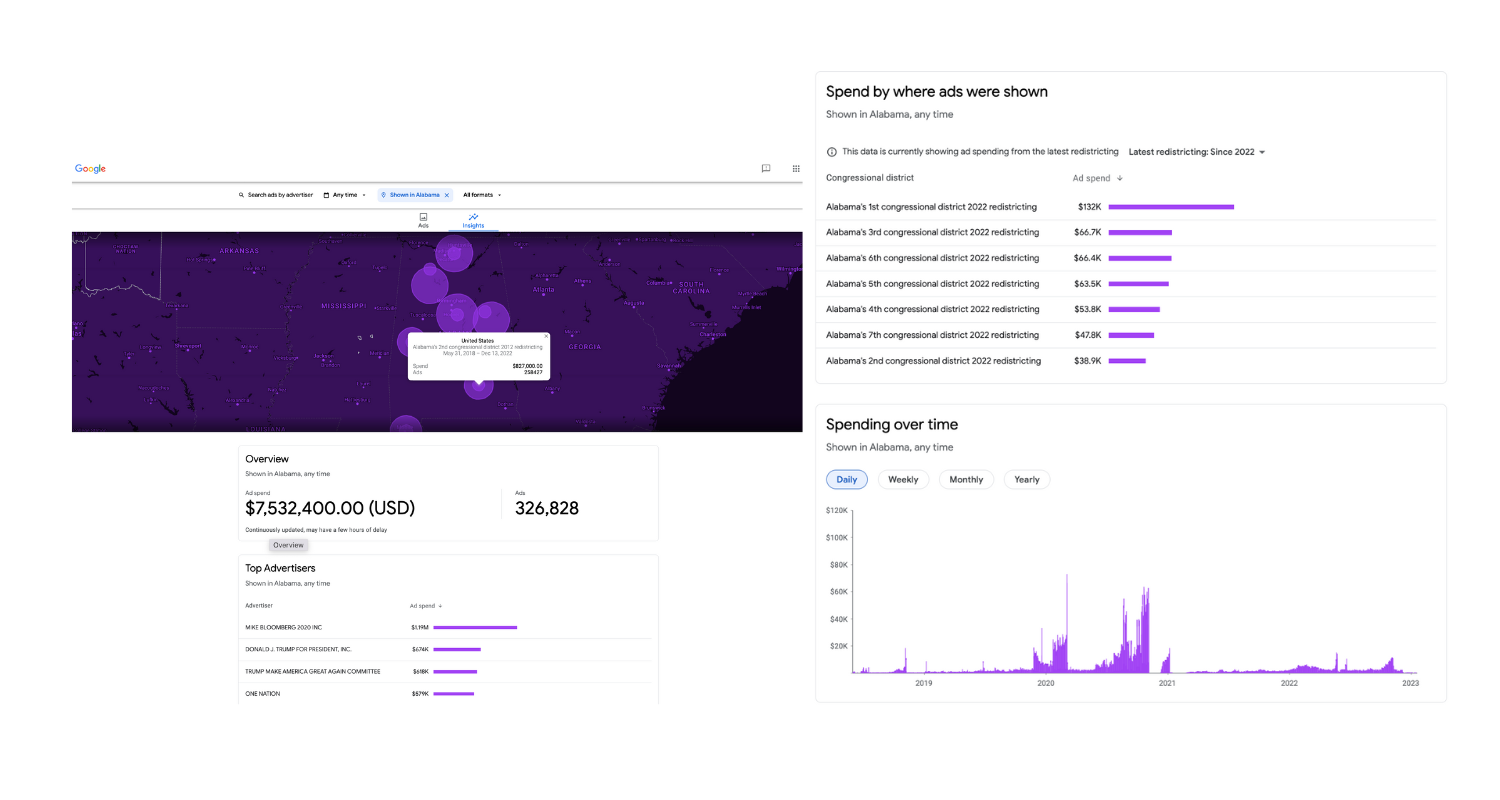
With the user interface, you can search and analyze ad spending over time in a specific location as broad as an entire country or as granular as a specific state or congressional district. For instance, the UI allows for search for spending in Alabama from 2018 to 2022. You can see top advertisers, and district by district spending amounts in Alabama.
For research looking into targeted political advertisement
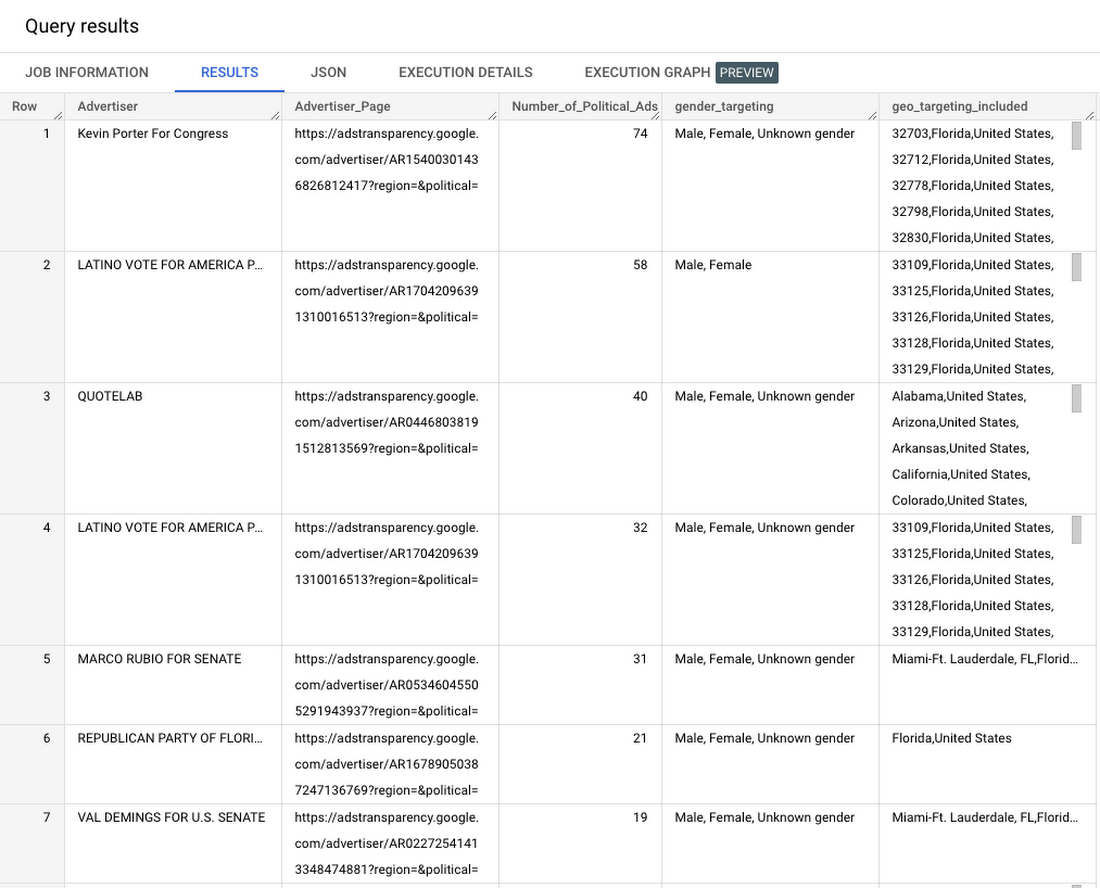
The dataset can also be used to identify political advertisers for a targeted demographic. For example, we can use BigQuery to write a query to identify political advertisers that targeted women in Florida over the 6 weeks leading up to the November 8, 2022 US midterm elections:
After running this query in the BigQuery console, the results show 149 ads, with details including the advertiser's name, advertiser page, gender and general location targeting of the ad , and the total number of election ads that advertiser ran for this demographic.
For researching election ads with high impressions
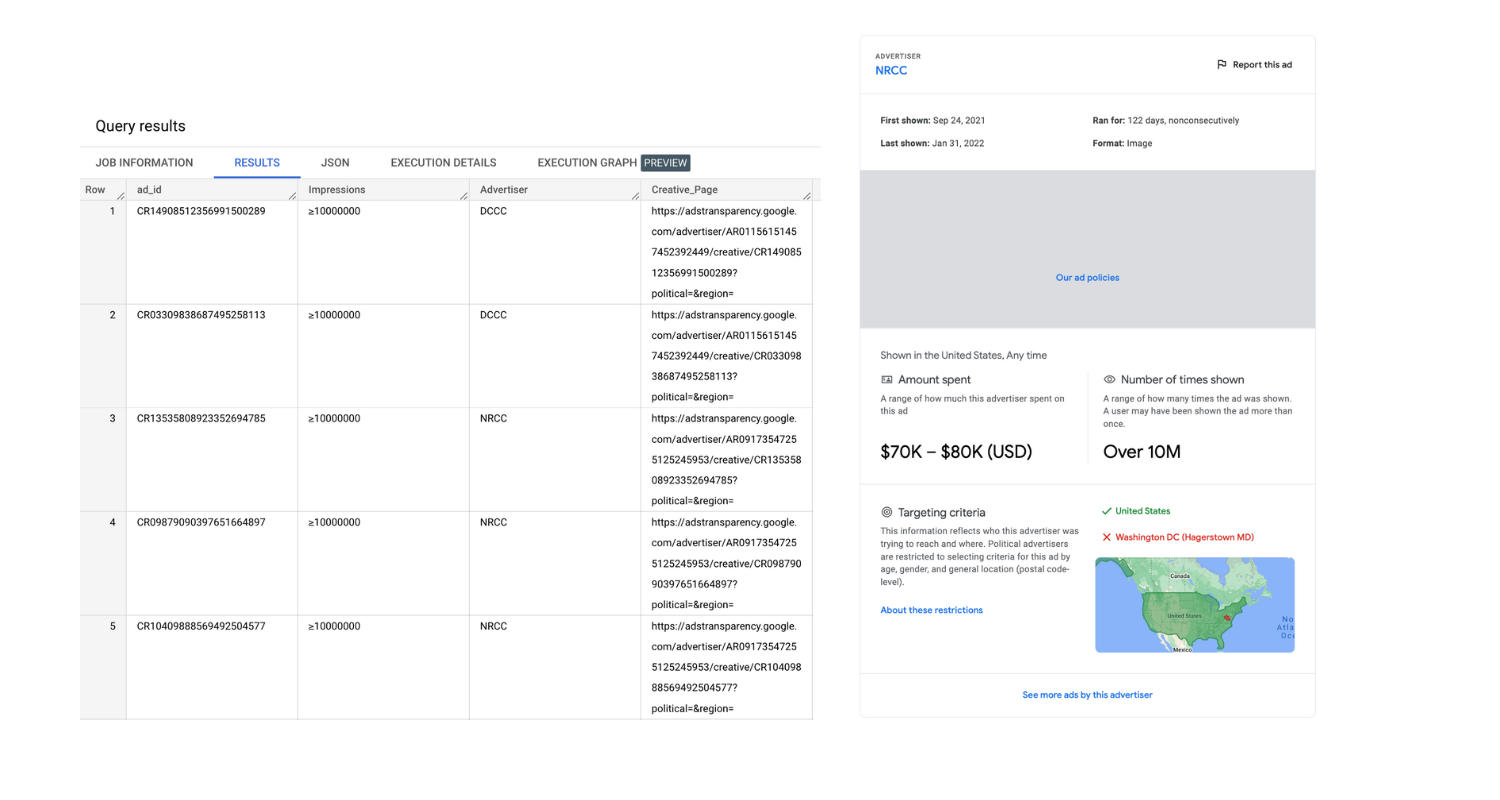
Another use case is analyzing election ads with large numbers of impressions, for example those that have reached over 1 million impressions. To do this, we can use the following SQL query in BigQuery:
The query returned over 24,790 ads and each row contains additional information like the election ad id (which can be useful to find the ad in the UI), impressions, advertiser name and a link to the election ad details. If you click on the link for the election ad details, you’ll see even more information on that specific ad.
Next steps
These are just a few of the many ways to use the Political Ads Transparency Report dataset.
A great way to get familiar with the dataset is through its visual UI; for example, you can check out all the election ads run by a specific advertiser. Then you can start running SQL queries on the BigQuery dataset at no cost by creating a BigQuery sandbox. The BigQuery sandbox enables you to query data within the limits of the free tier without needing a credit card. If you decide to enable billing and go above the free tier threshold, you are subject to regular BigQuery pricing.
To learn more about the Political Ads Transparency Report dataset, head to the Marketplace listing.
We would like to thank Juan Uribe (Software Engineer) and Michael Yu (Software Engineer) for their help in creating this blog post.