Climate data
As a Greater Boston coastal watershed, we are seeing more intense rainfall, heat waves and extreme storms. The most severe harms from climate change fall disproportionately upon underserved communities who are least able to prepare for, and recover from, heat waves, poor air quality, flooding, and other impacts.

Photo: Erica Wood
Flash floods, flash droughts
Historic precipitation patterns in Massachusetts meant small amounts of rain and snow approximately every three days. Now more of our precipitation is occurring as winter Nor’easters and summer thunderstorms and hurricanes, with longer dry periods in between. This new pattern is beginning to overwhelm aging stormwater infrastructure and stress native ecosystems.
Our Climate is Moving South
According to these data from Climate Ready Boston, the number of summer days above 90 degrees F has doubled since 1990, and are expected to double again around mid-century. This means that Greater Boston summers around 2050 will be closer to those of Washington, DC’s old normal, and late century Boston will feel more like Birmingham, Alabama’s old normal. Imagine how hot it will be in Birmingham, Alabama!
This hotter climate will disproportionately impact our most urban watershed communities—those with the least trees and most impervious surface. Check out the map of heat islands in our watershed using data collected by volunteers in the 21 cities of the Mystic River watershed.

Climate Ready Boston projections of summer heat
Once-in-a-lifetime storms are becoming more common
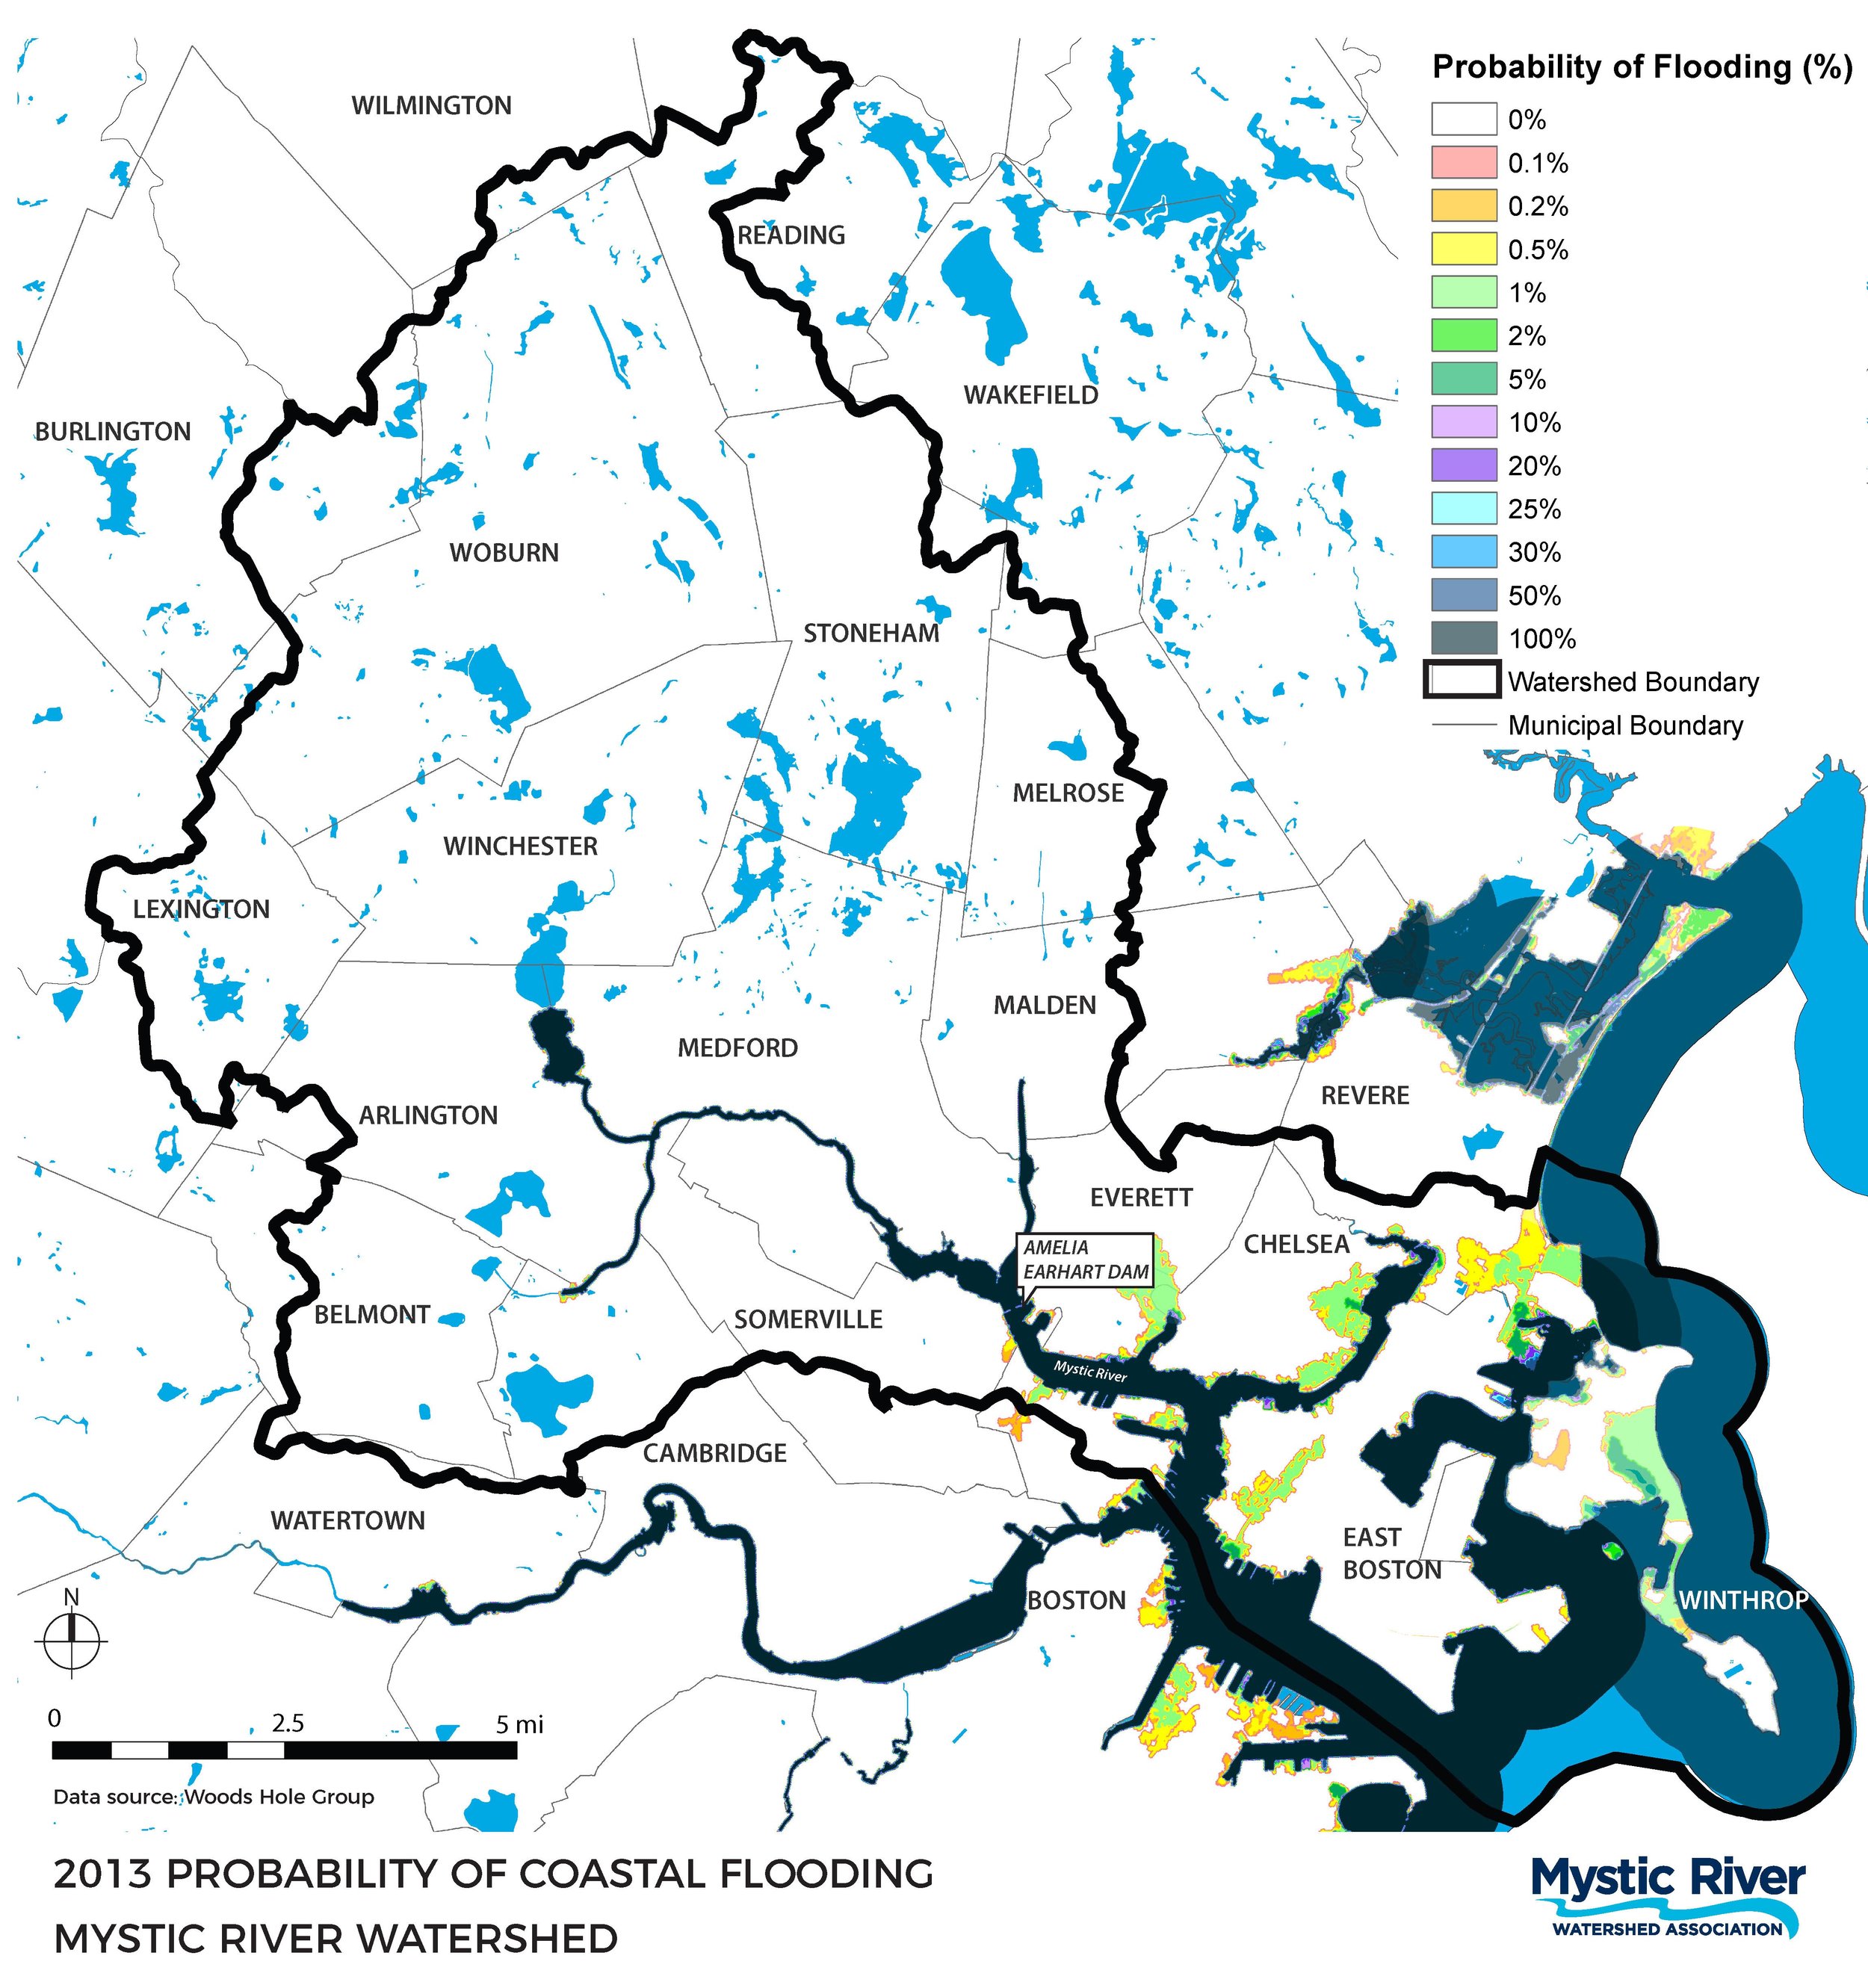
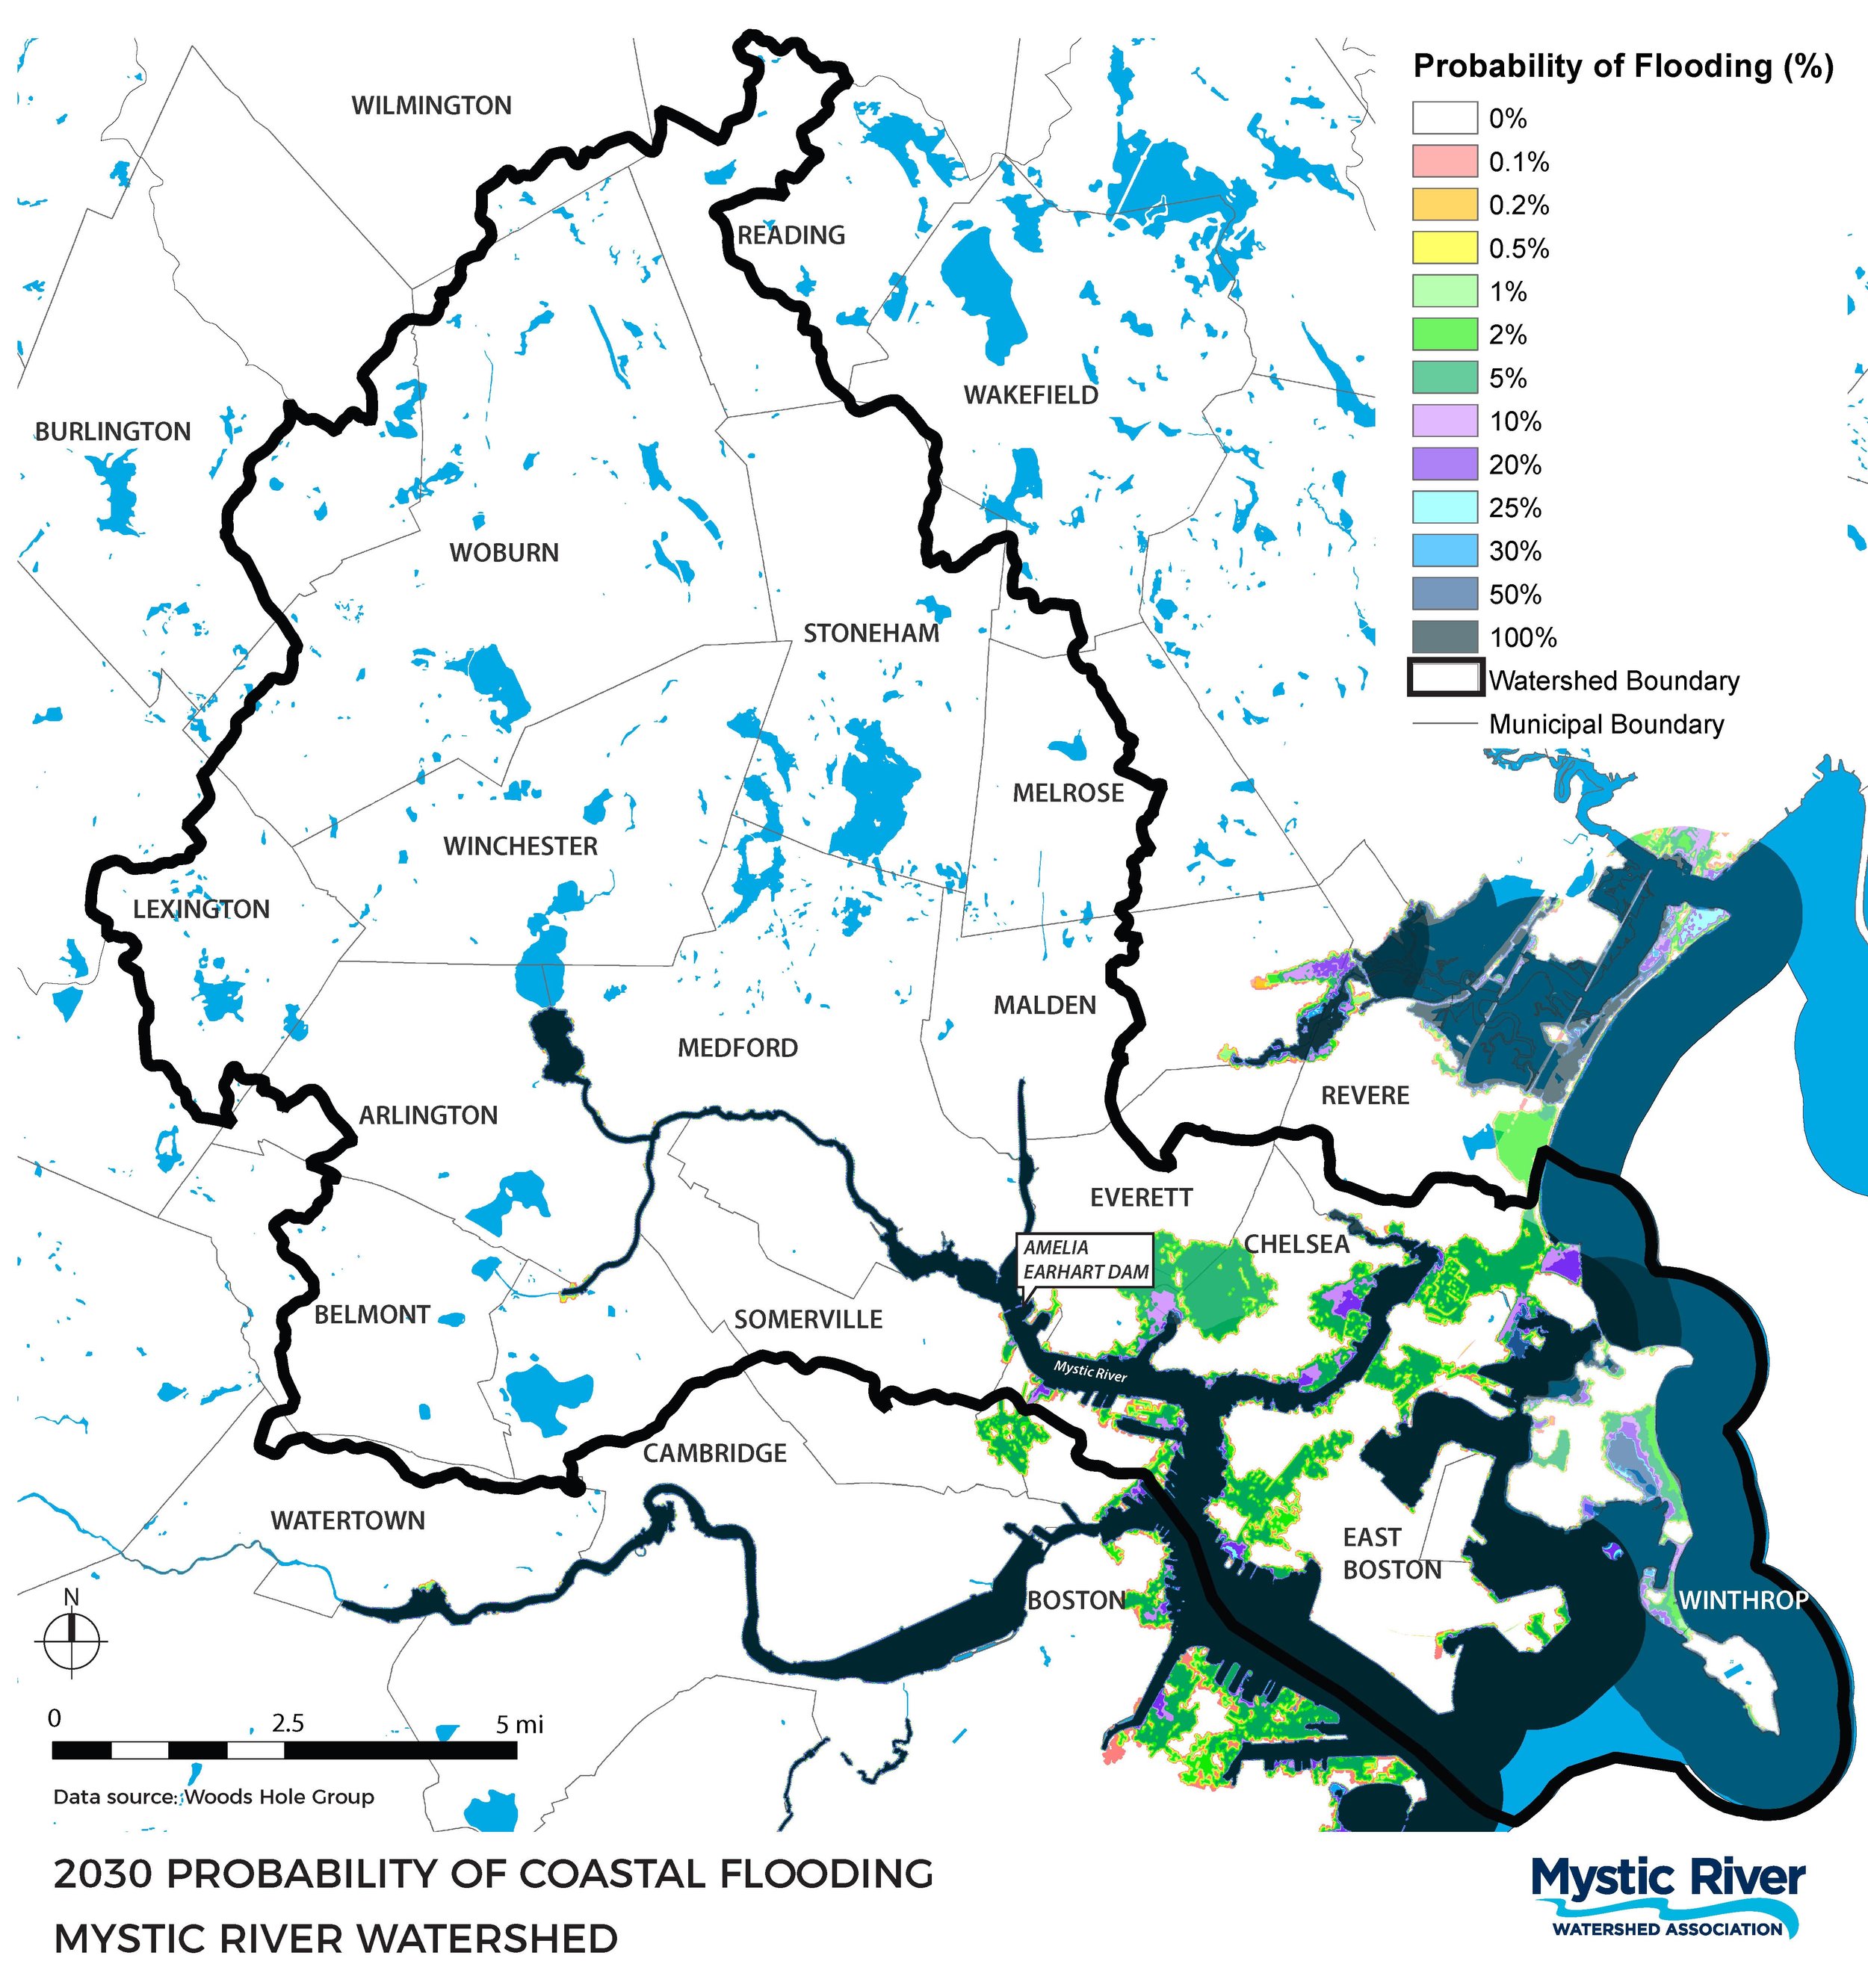
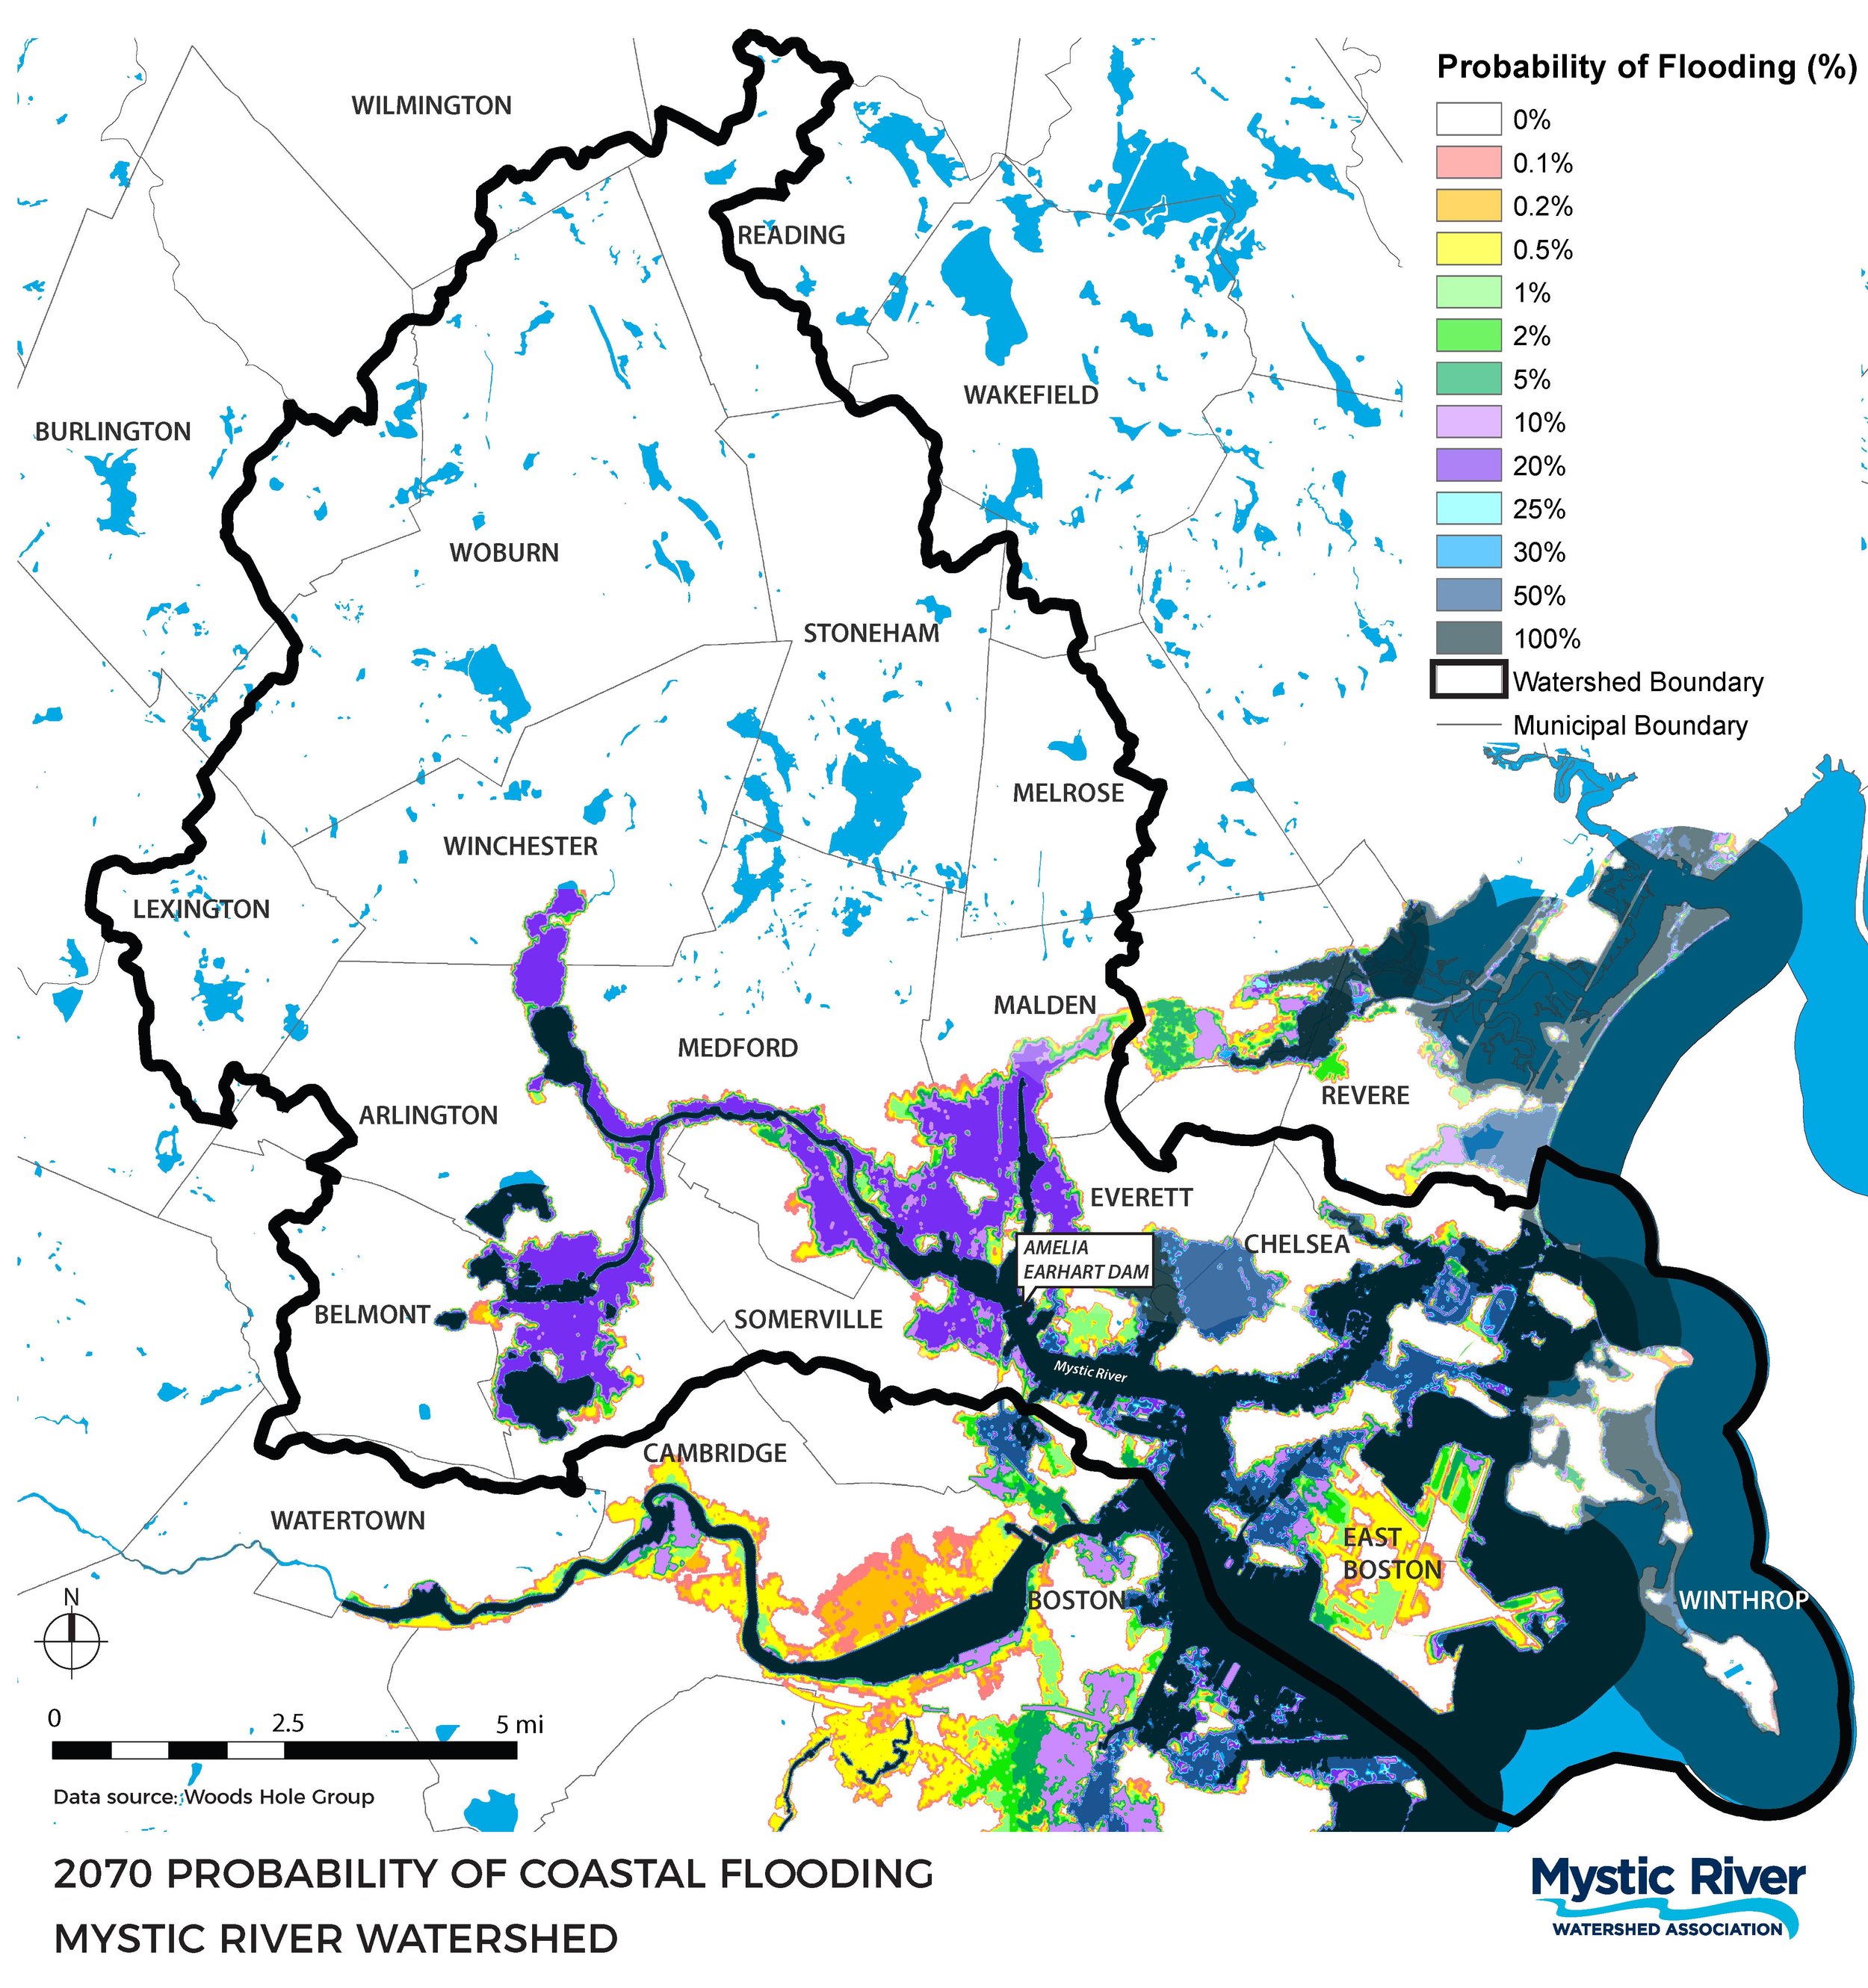
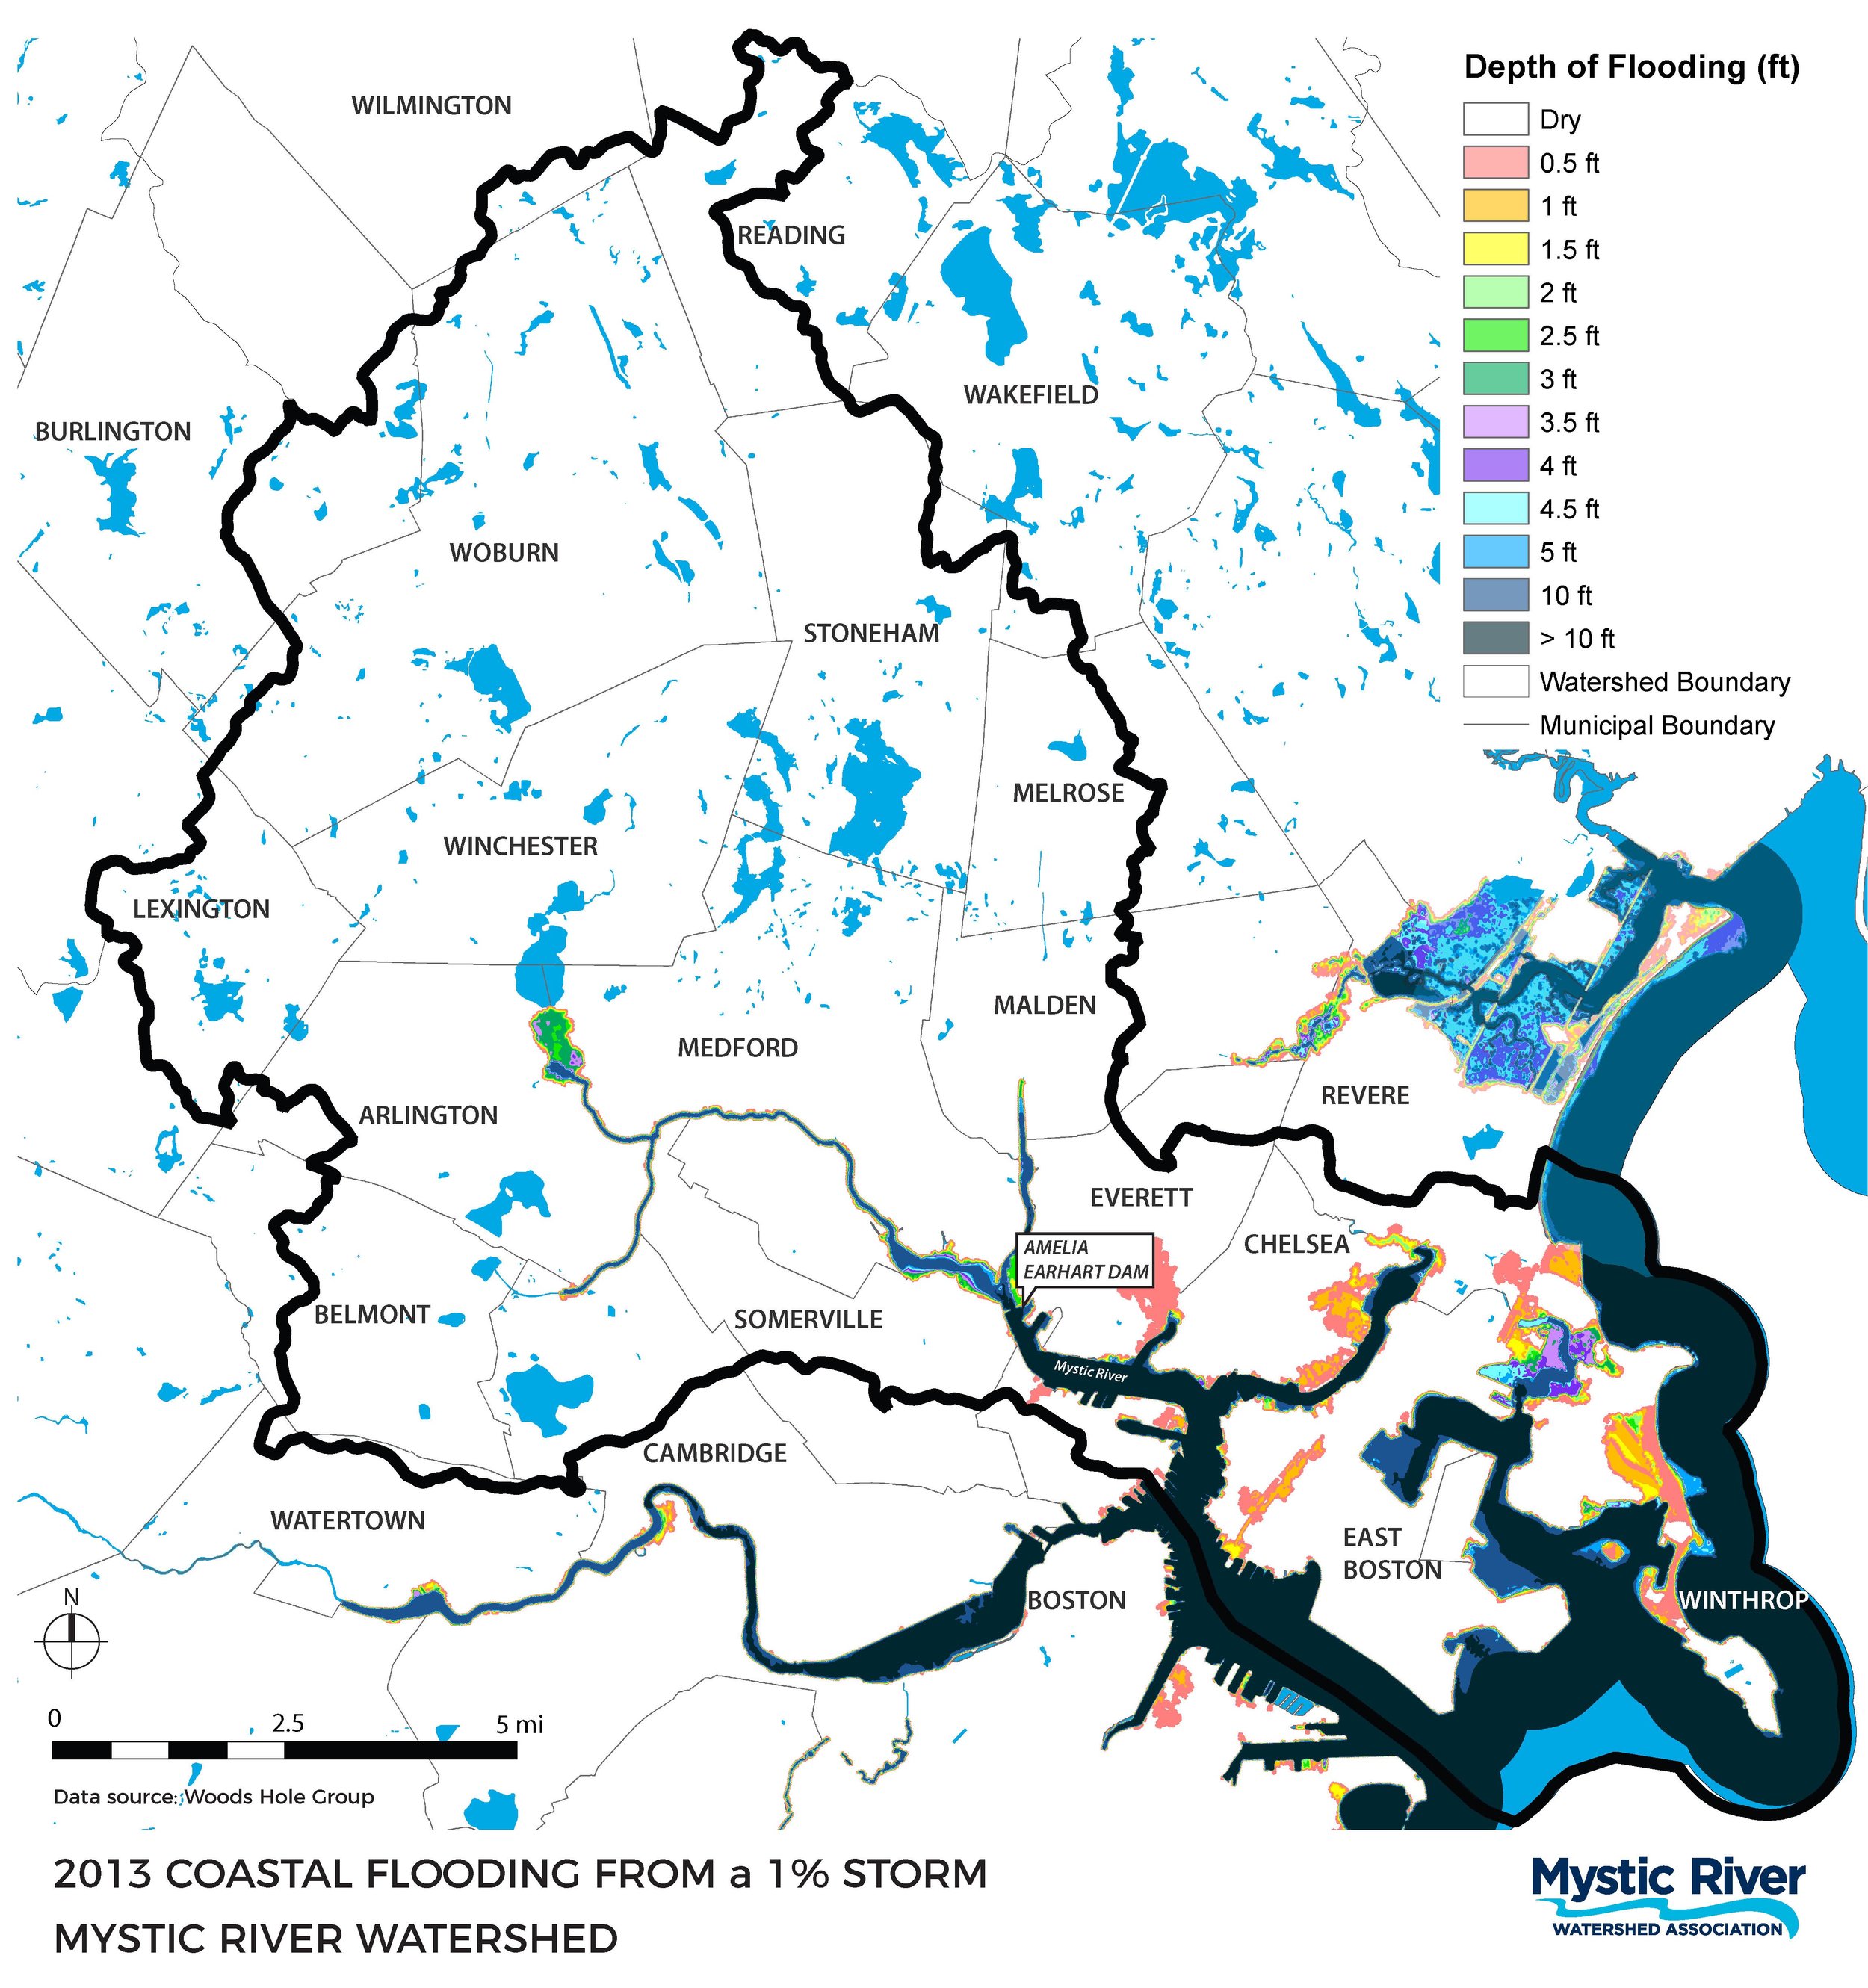
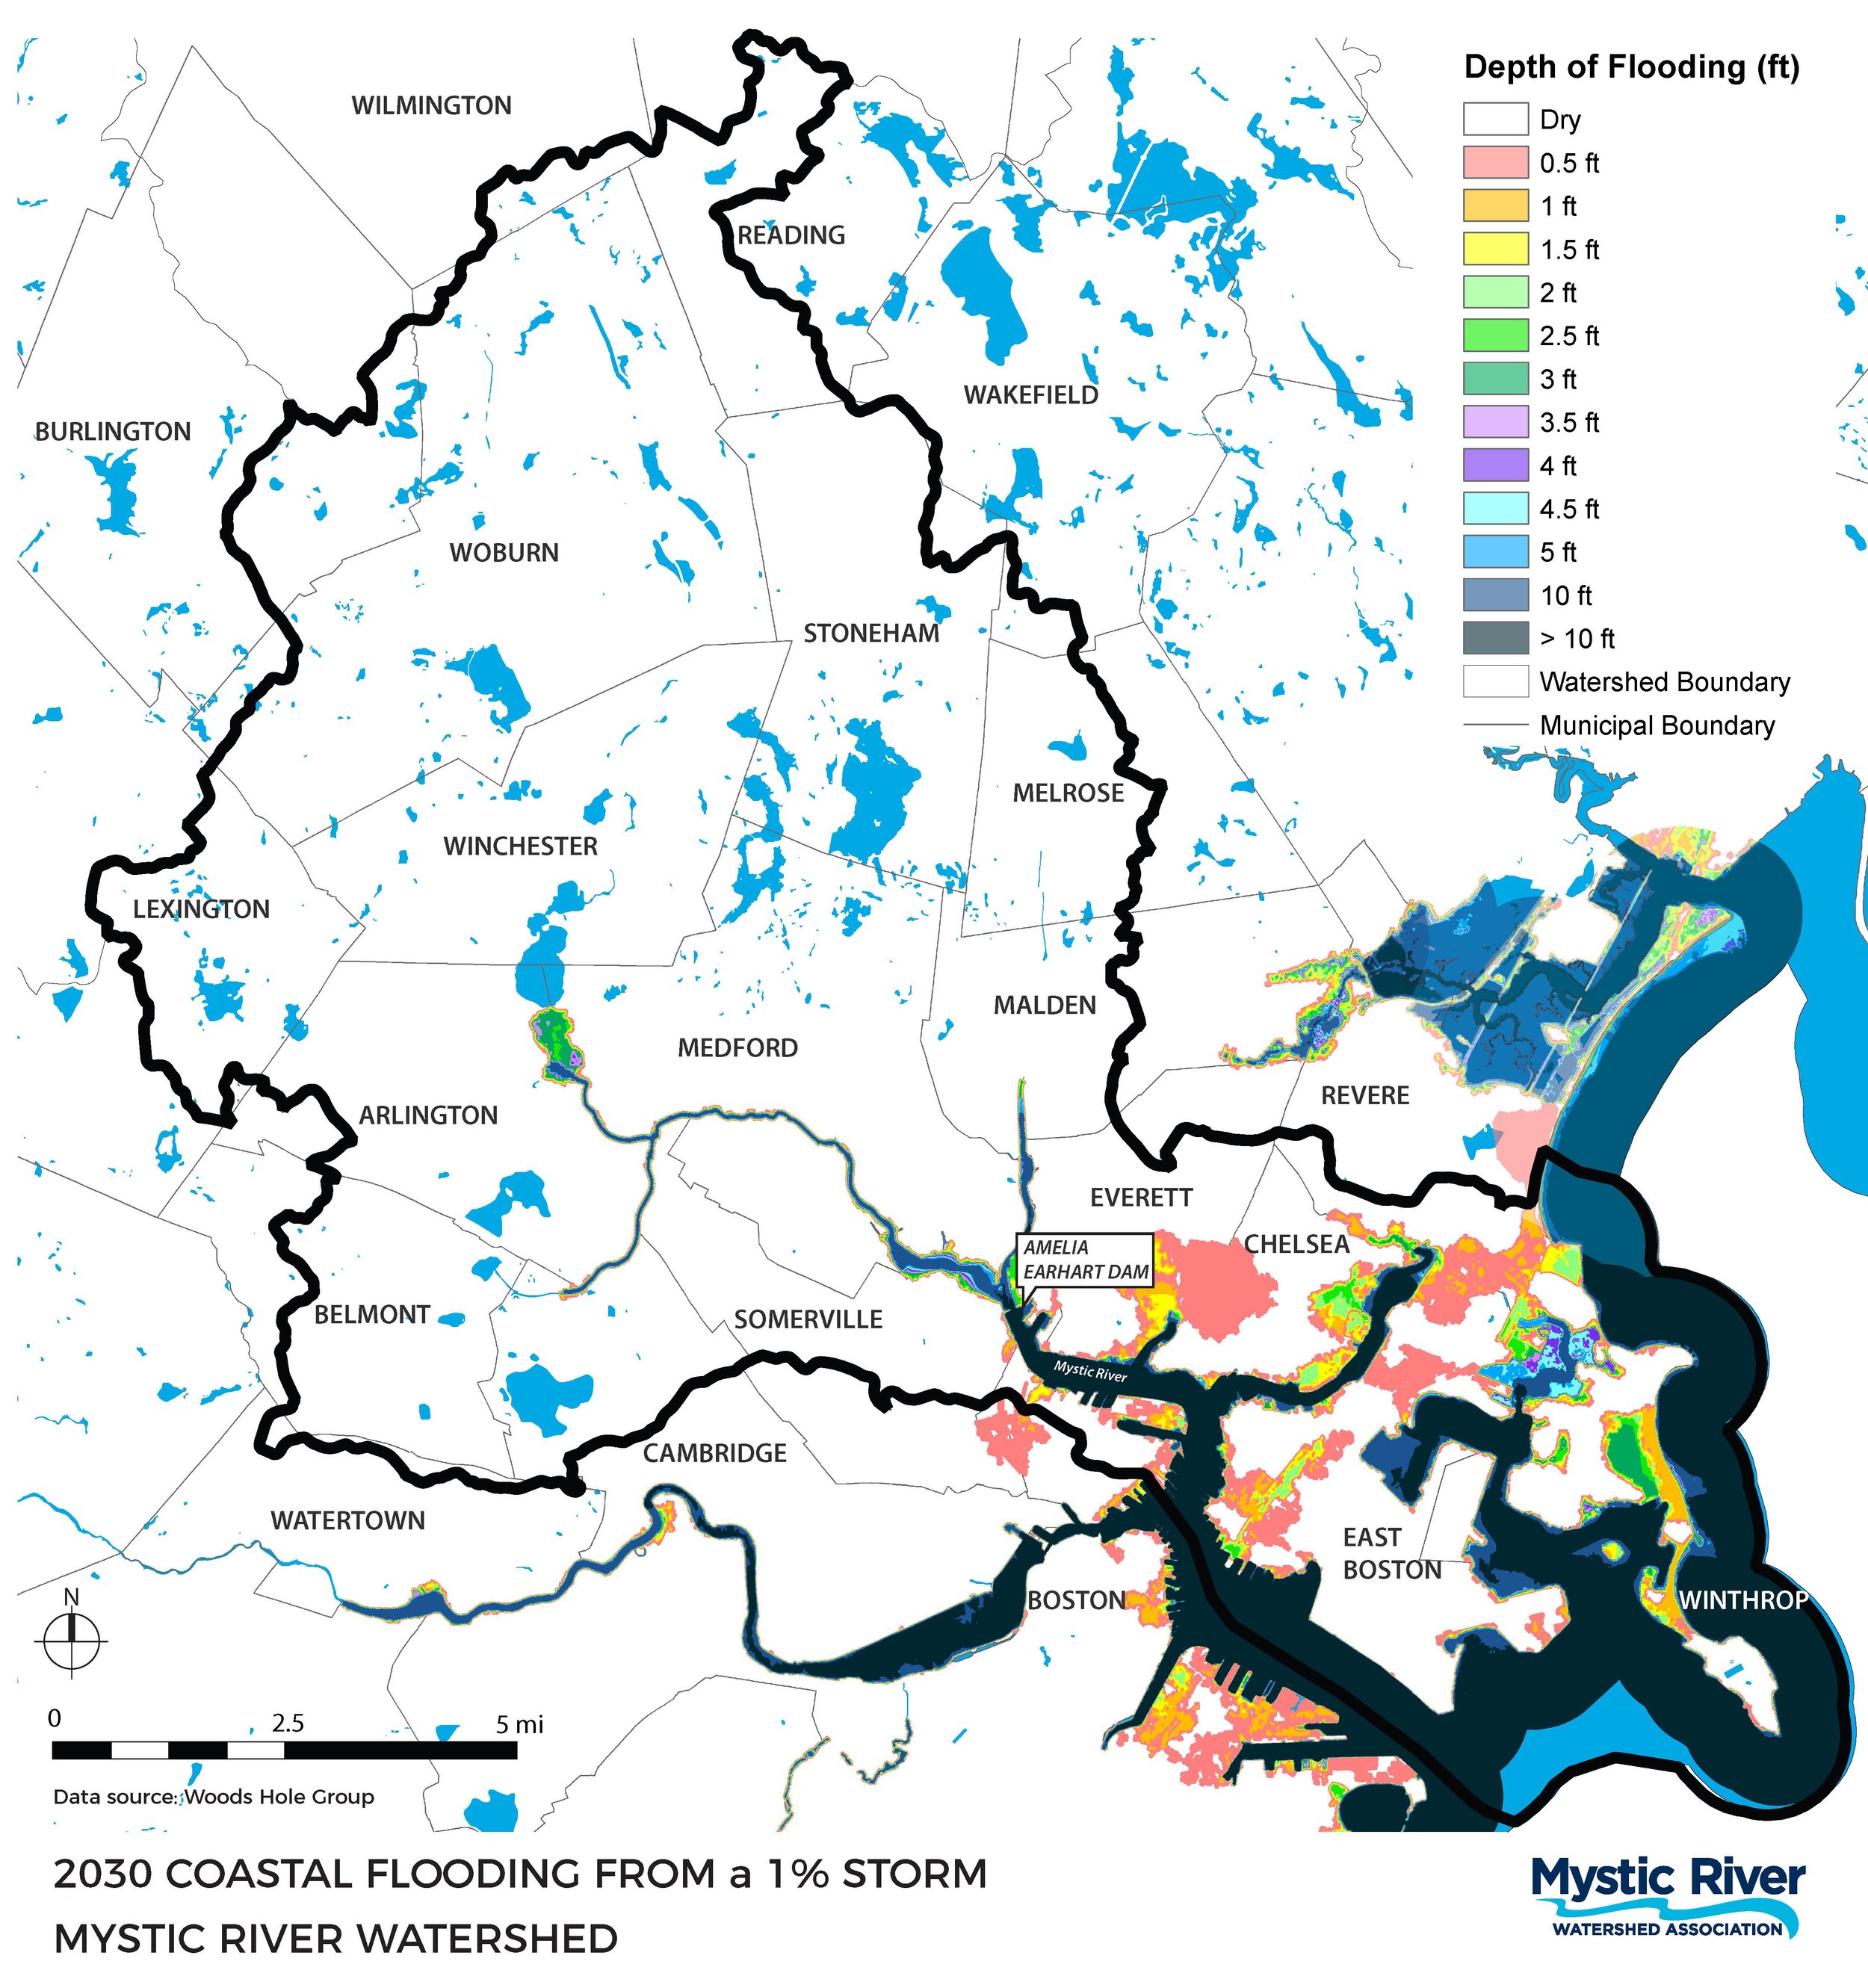
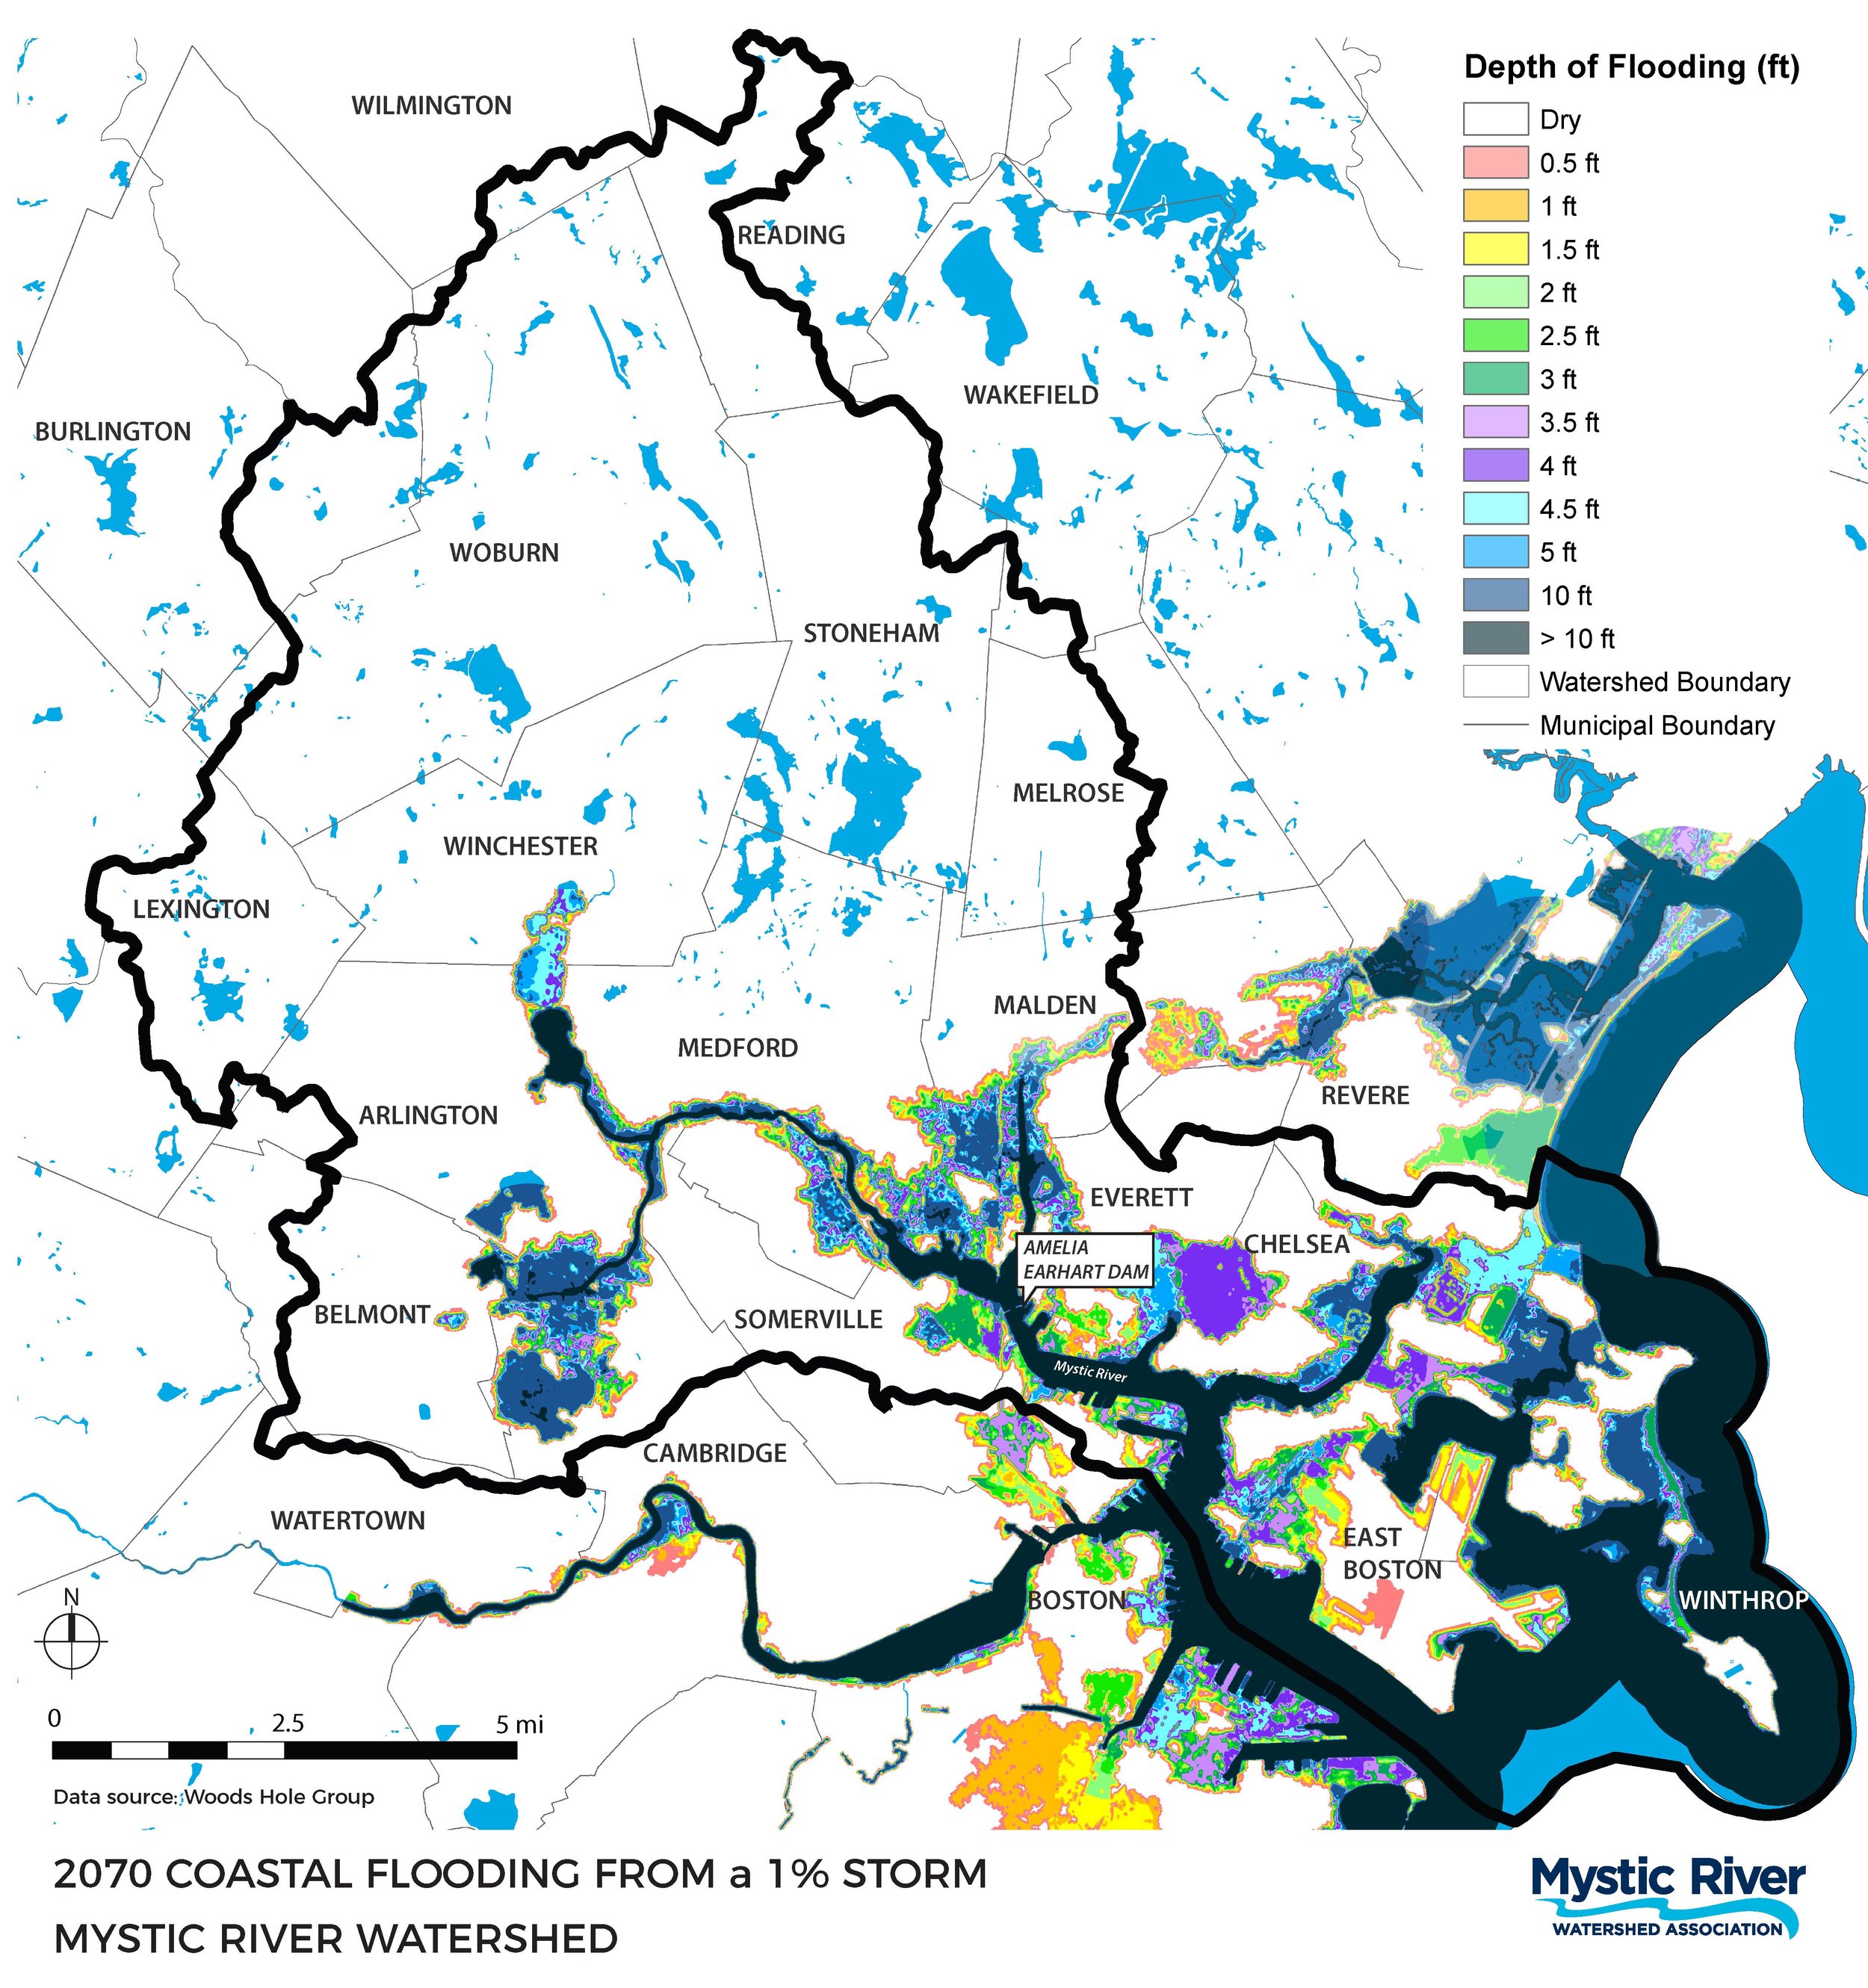
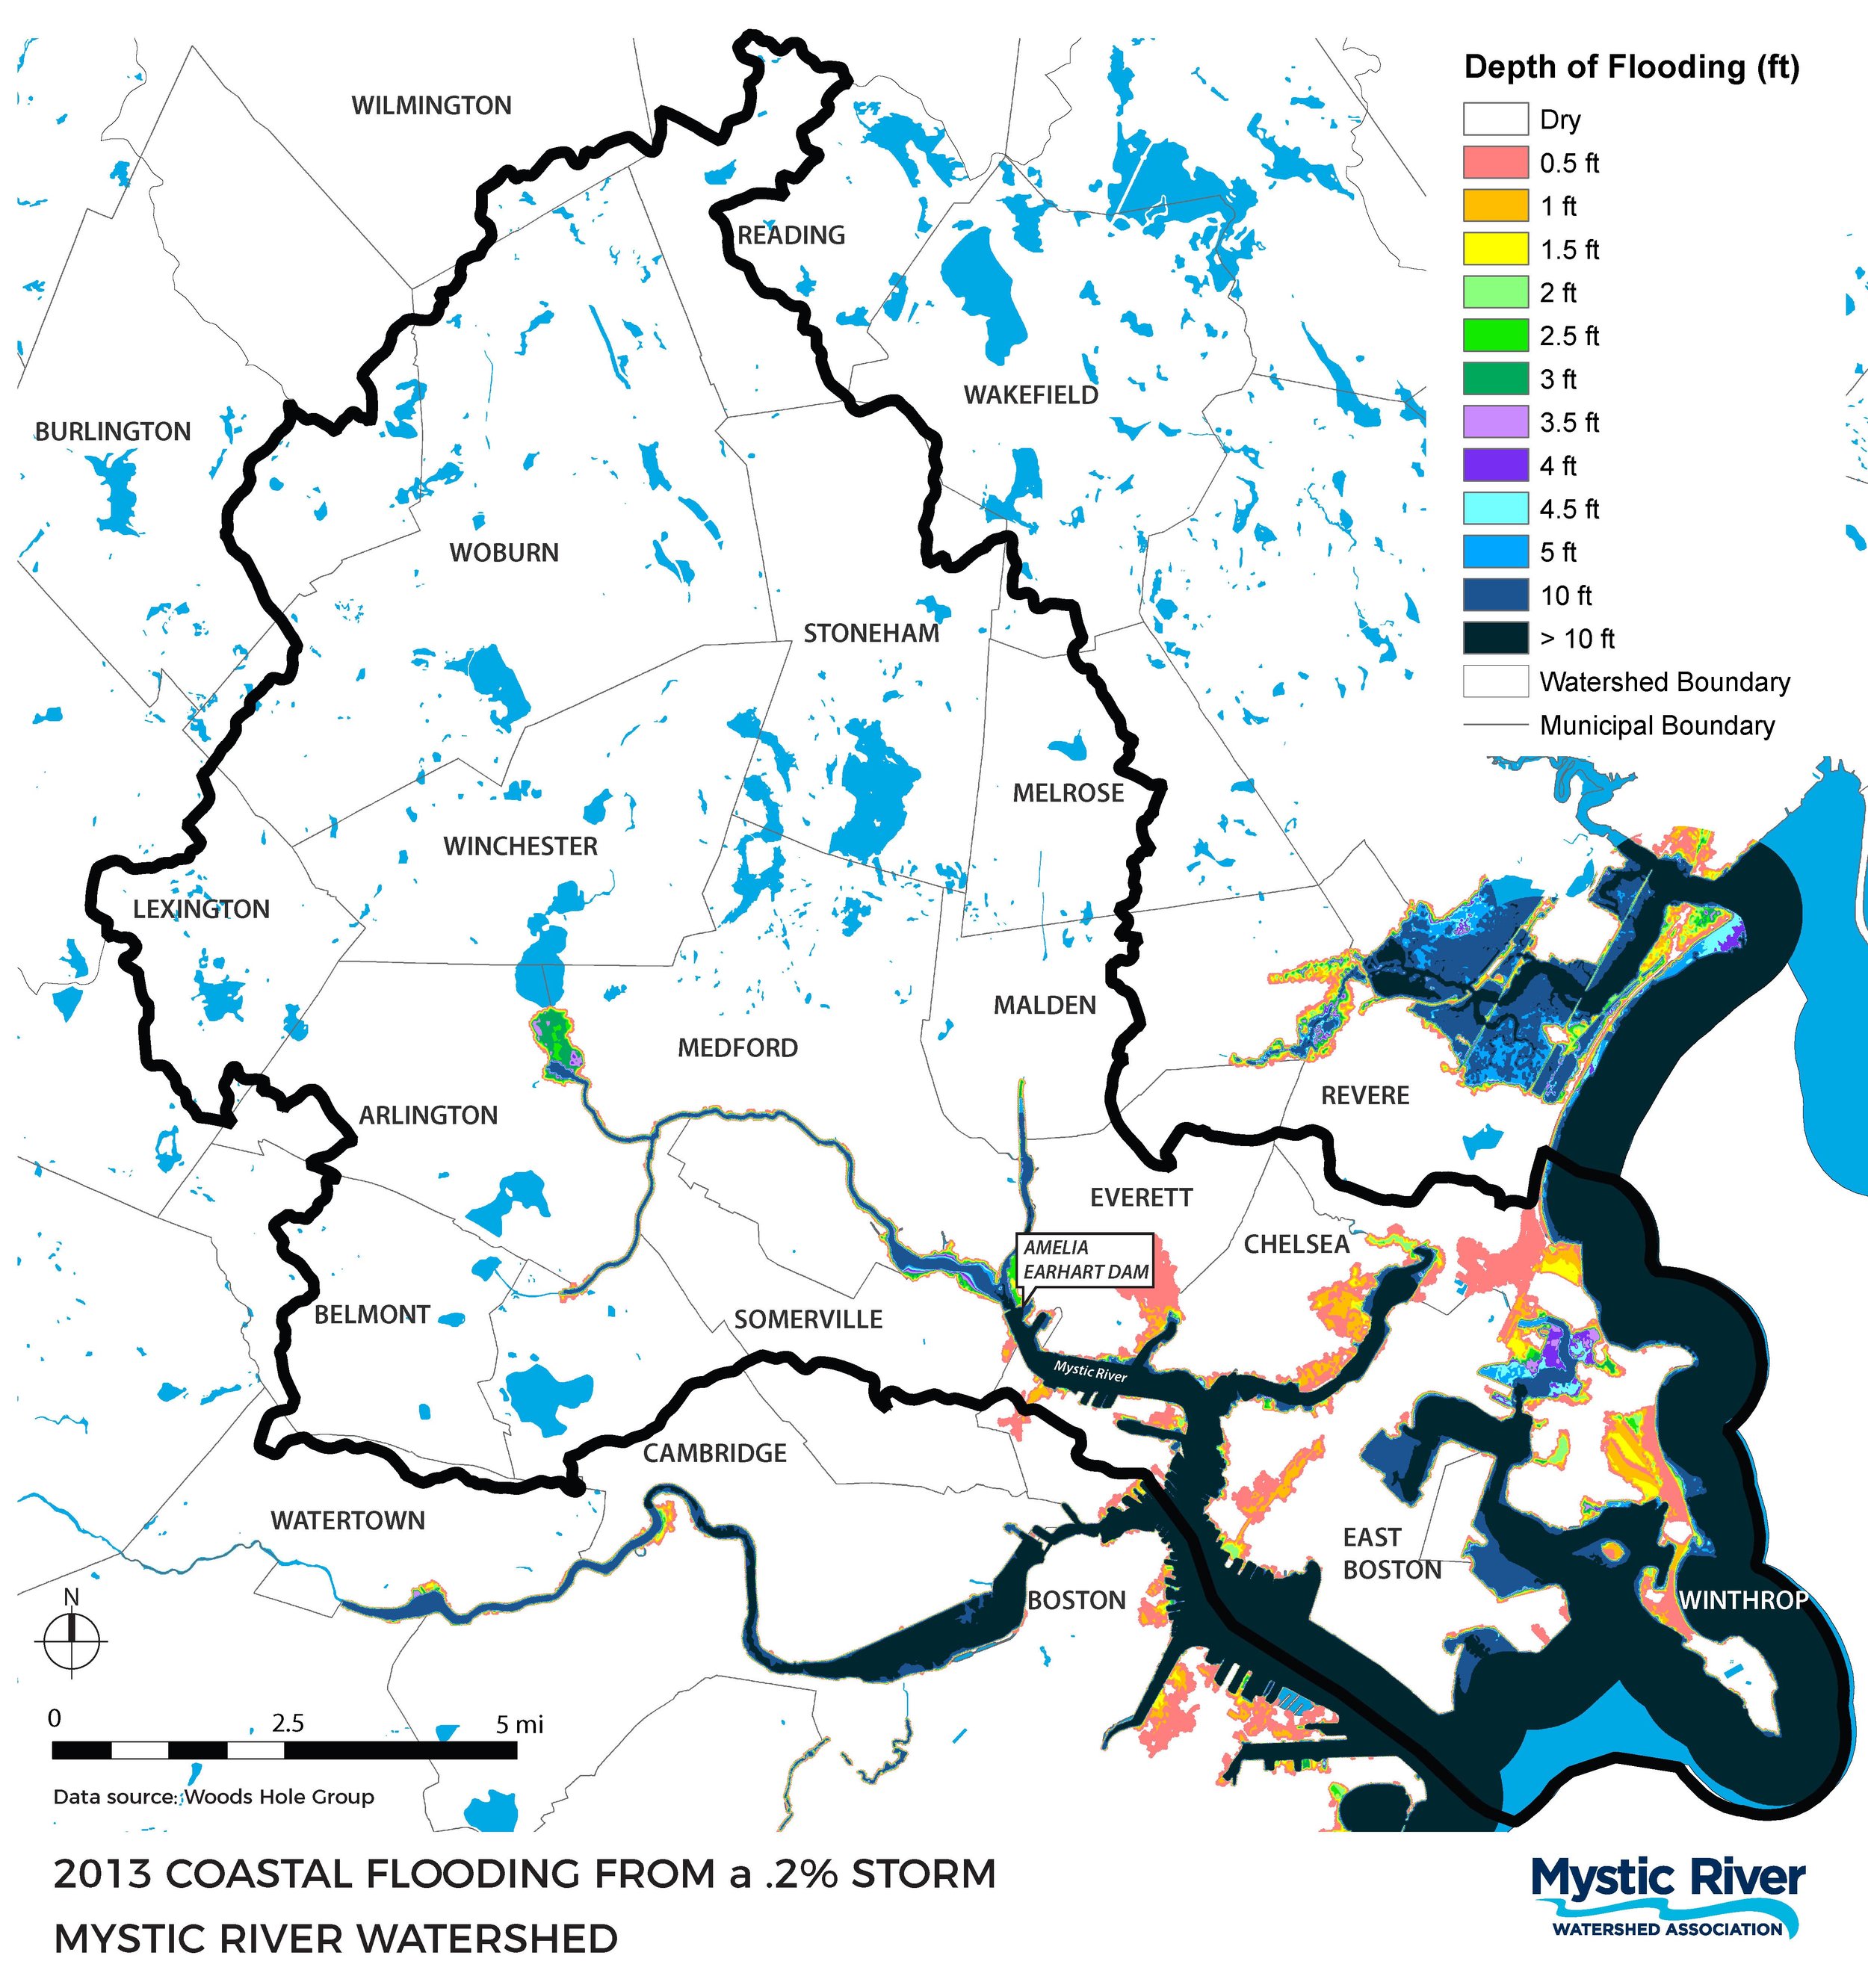
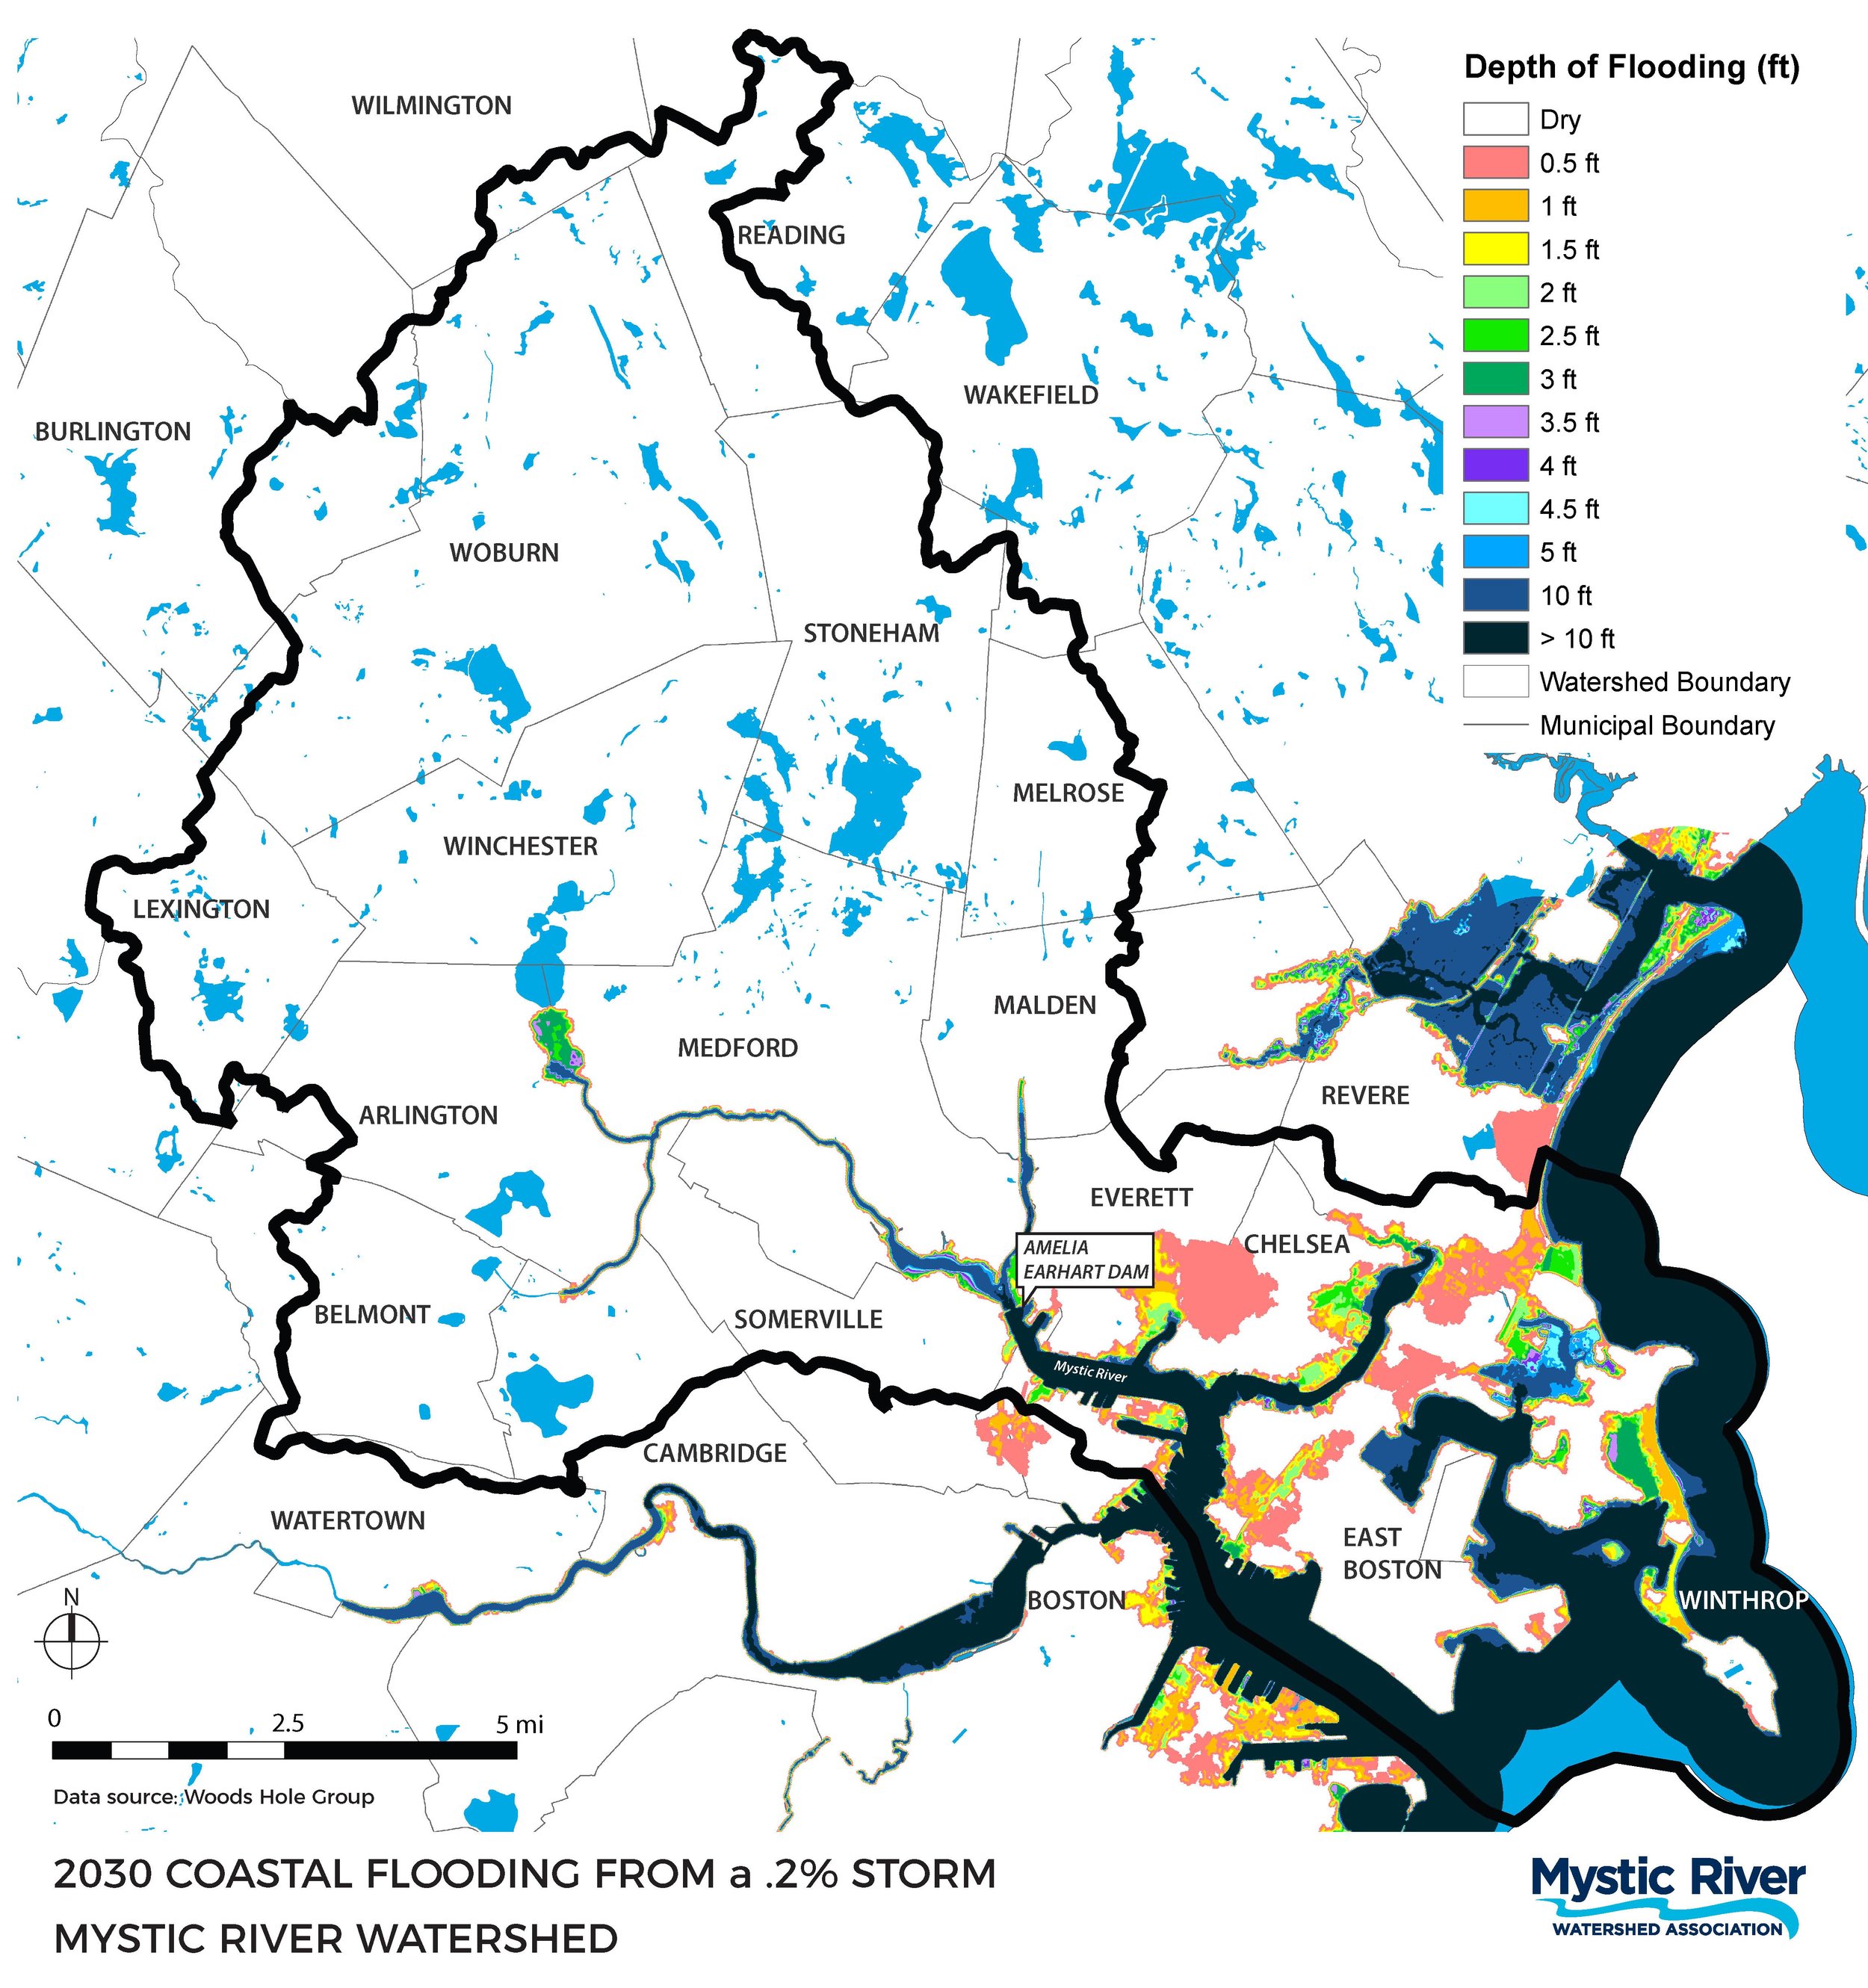
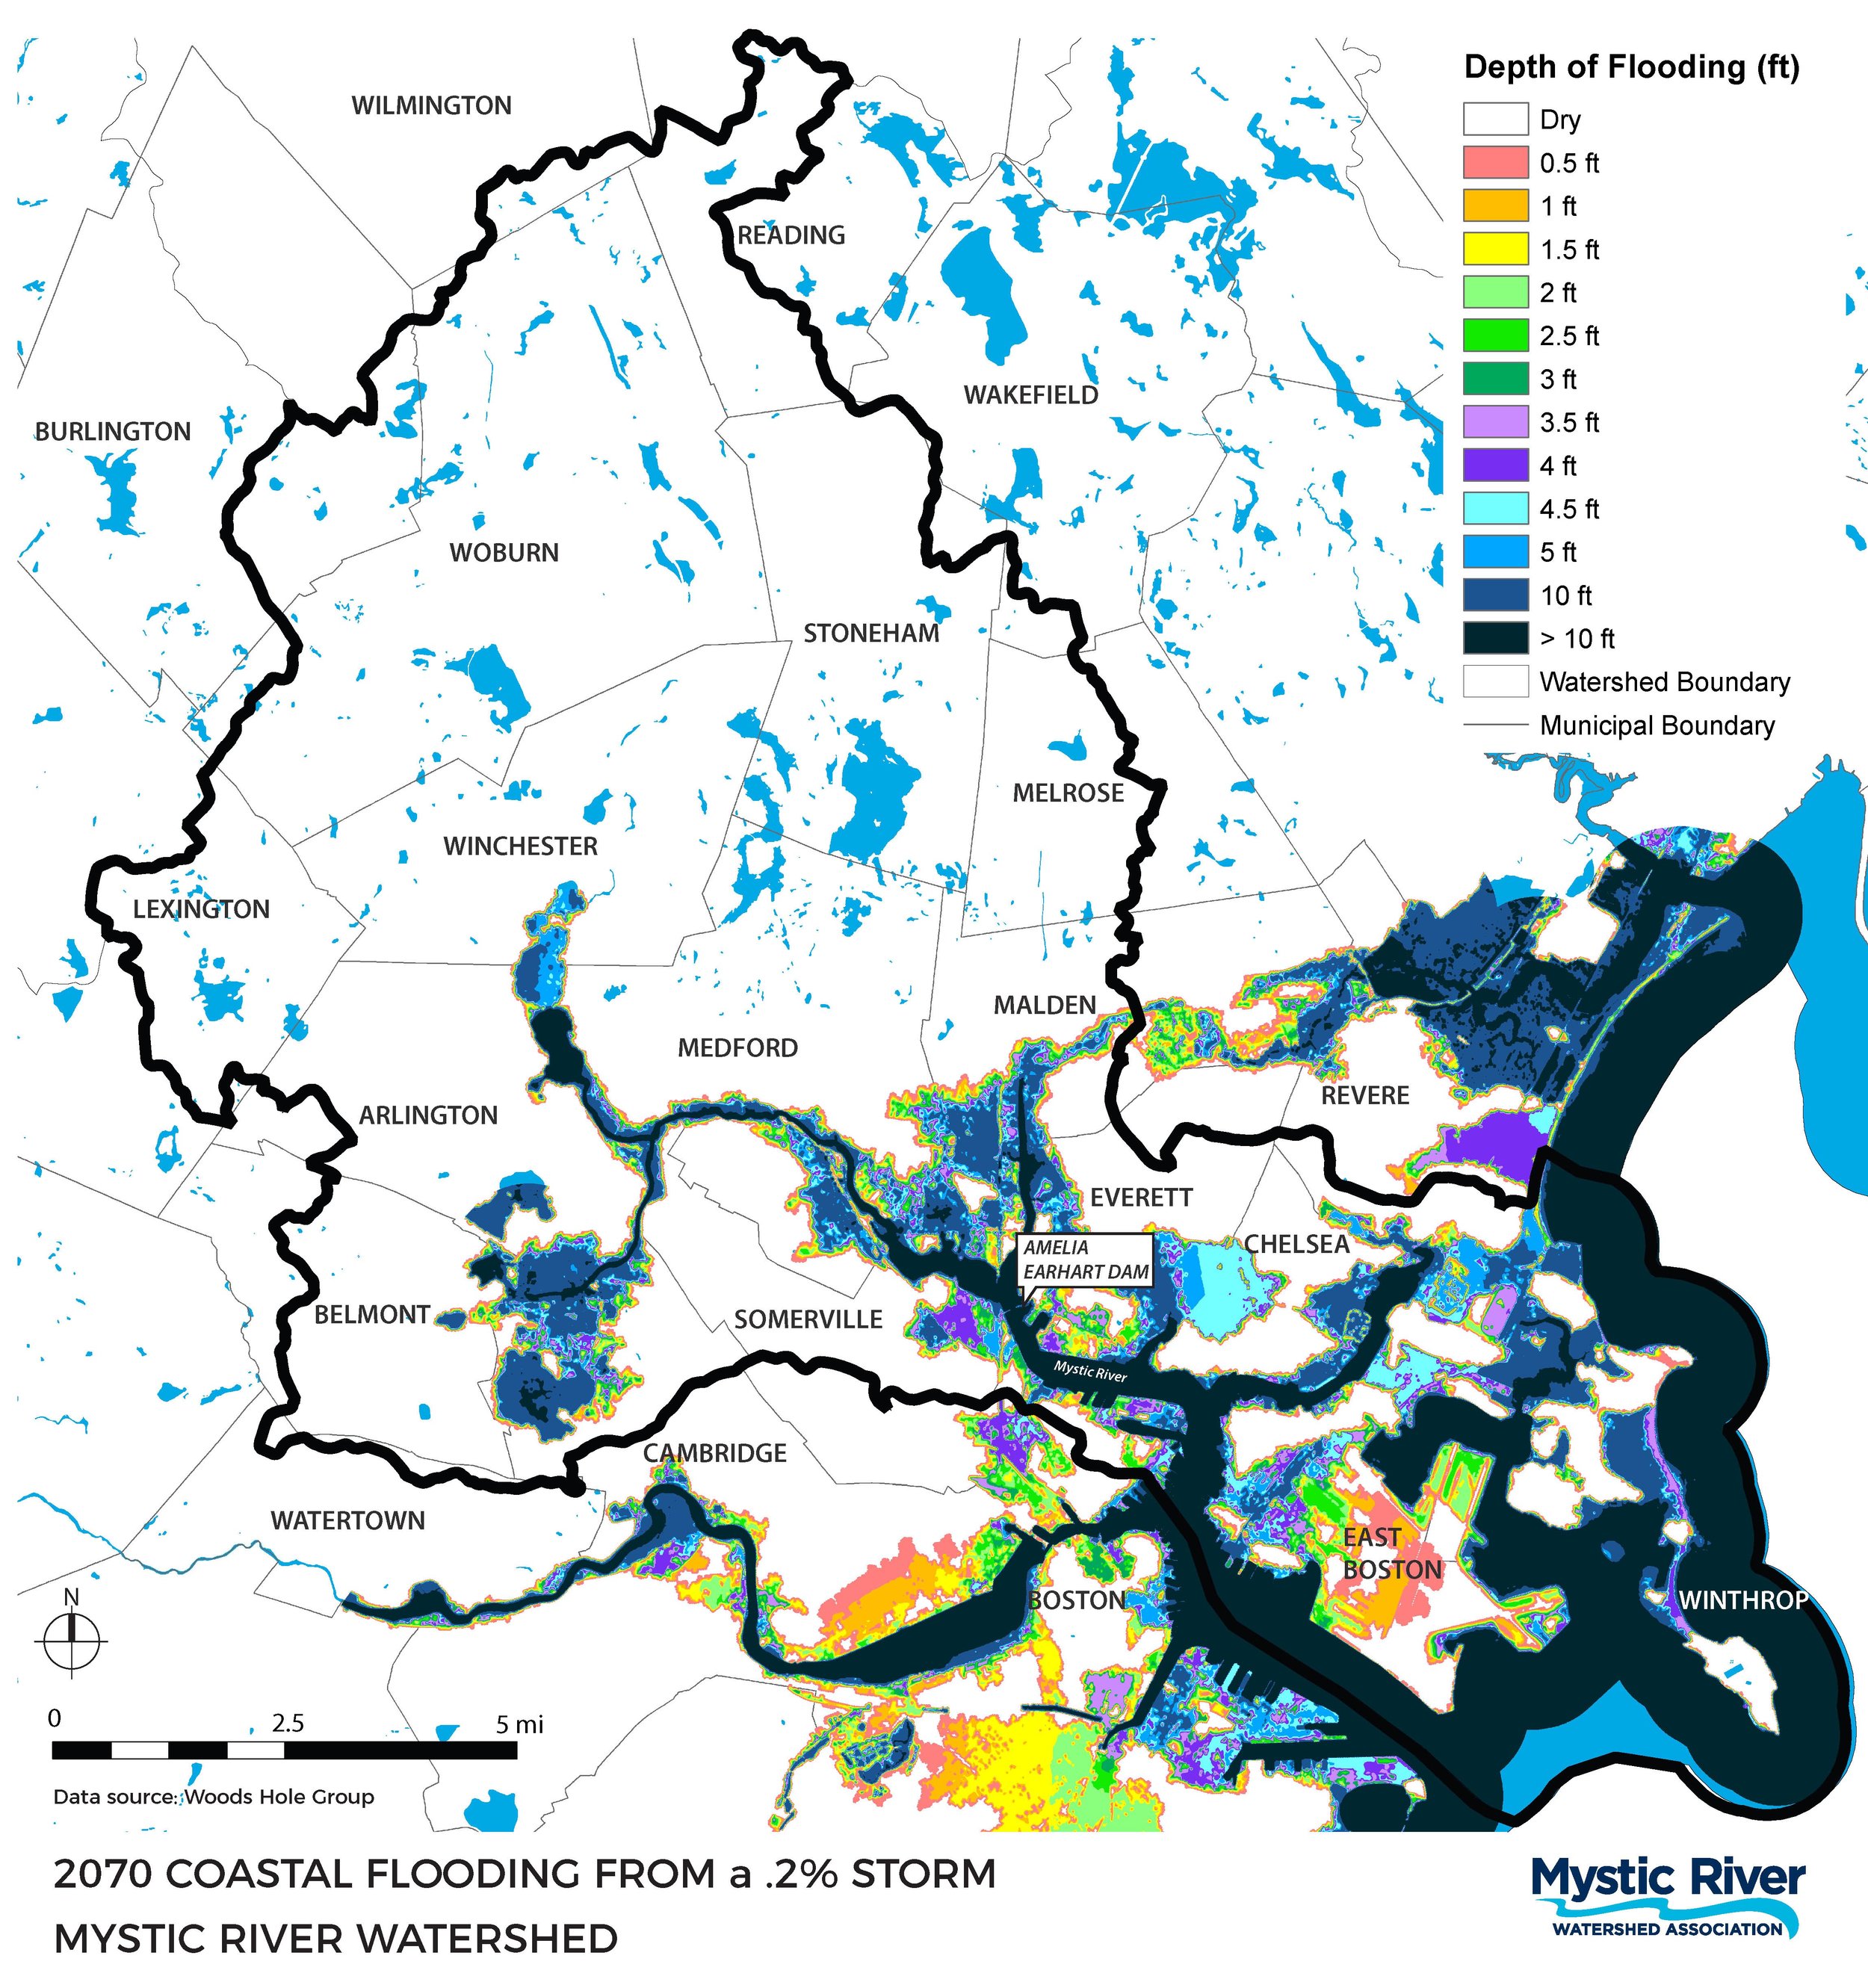
This graphic shows the likelihood of coastal flooding in the Lower Mystic Watershed up to 2070 when Boston Harbor is 3 1/2 feet higher than it was in 2000. Some predictions: Downtown Malden and Medford and Cambridge’s drinking water reservoir will flood on average every five years. Parts of Chelsea, Everett and Boston will flood twice daily.
Map Notes: % Probability: percent annual chance of occurrence of flood event | 1% Storm: flood depths (in feet) for a 100-year storm | .2% Storm: flood depths (in feet) for a 500-year storm
Disproportionate impact
Extreme weather hits some people harder than others. People with greater exposure, such as outdoor workers or greater sensitivity, such as people in poor health, are affected more by heat waves and storms. People who lack the financial or emotional resources have lower adaptive capacity to recover. These three characteristics differ among populations and affect their vulnerability to climate change. Additionally, studies have shown that the most severe harms from climate change fall disproportionately upon underserved communities. This means that the environmental justice populations within the watershed are being hardest hit.
What Can we do?
MyRWA is helping our communities adapt to more intense rainfall, heat waves, extreme storms and the disproportionate impact these can have on different residents.